FIGURE SUMMARY
Title

Antioxidant, Mineralogenic and Osteogenic Activities of Spartina alterniflora and Salicornia fragilis Extracts Rich in Polyphenols

Authors
Roberto, V.P., Surget, G., Le Lann, K., Mira, S., Tarasco, M., Guérard, F., Poupart, N., Laizé, V., Stiger-Pouvreau, V., Cancela, M.L.
Source
Full text @ Front Nutr

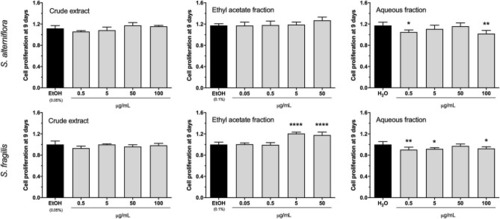
Proliferative activity of S. alterniflora (upper panel) and S. fragilis (lower panel) extracts in vitro. VSa13 cells were exposed for 9 days to the crude extracts (0.5, 5, 50, 100 μg/mL), ethyl acetate fractions (0.05, 0.5, 5, 50 μg/mL) or aqueous fractions (0.5, 5, 50, 100 μg/mL) of each plant, or to the respective vehicles (0.05% ethanol, 0.1% ethanol and water). Results are presented as fold-change over the control value (set to 1). Values are presented as mean ± standard deviation (n = 5). Asterisks indicate values significantly different from the control values (one-way ANOVA followed by Dunnett's multiple comparison test; *p < 0.05, **p < 0.01, ****p < 0.0001).

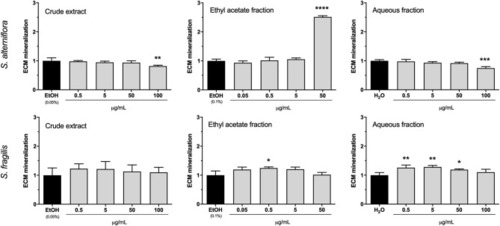
Mineralogenic activity of S. alterniflora (upper panel) and S. fragilis (lower panel) extracts in vitro. VSa13 cells were exposed for 17 days to the crude extracts (0.5, 5, 50, 100 μg/mL), ethyl acetate fractions (0.05, 0.5, 5, 50 μg/mL) or aqueous fractions (0.5, 5, 50, 100 μg/mL) of each plant, or to the respective vehicles (0.05% ethanol, 0.1% ethanol or water). Results are presented as fold-change over the control value (set to 1). Values are presented as mean ± standard deviation (n = 4). Asterisks indicate values significantly different from the control values (one-way ANOVA followed by Dunnett's multiple comparison test; *p < 0.05, **p < 0.01, ***p < 0.001, ****p < 0.0001).

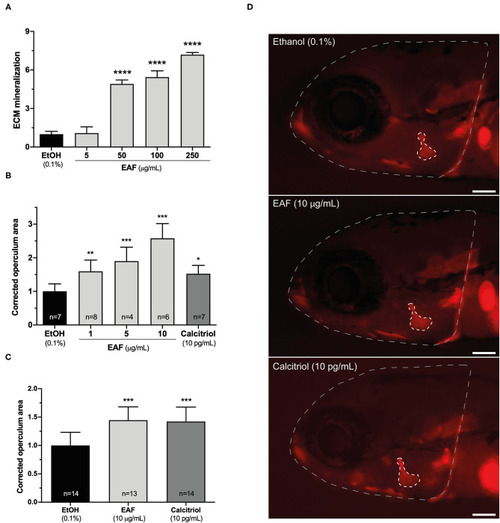
Mineralogenic and osteogenic activities of S. alterniflora ethyl acetate fraction. (A) EAF mineralogenic activity was determined in VSa13 cell cultures induced for ECM mineralization for 17 days while exposed to 5, 50, 100 and 250 μg/mL of the extract or 0.1% ethanol (n = 4). (B,C) EAF osteogenic activity was determined in 9-dpf zebrafish larvae exposed for 48 h to 1, 5, 10 μg/mL of EAF, 10 pg/mL of calcitriol or 0.1% ethanol (n > 4) (B) and in 3-dpf zebrafish larvae exposed for 72 h to 10 μg/mL of EAF, 10 pg/mL of calcitriol or 0.1% ethanol (n > 13) (C). (D) Fluorescence images of alizarin red S-stained larvae exposed to the different conditions/treatments. Areas of the head and operculum are evidenced by dashed lines. White bar represents 100 μm. Values are presented as mean ± standard deviation. Asterisks indicate values significantly different from the control values (one-way ANOVA followed by Dunnett's multiple comparison test; *p < 0.05, **p < 0.01, ***p < 0.001, ****p < 0.0001).

Acknowledgments
This image is the copyrighted work of the attributed author or publisher, and ZFIN has permission only to display this image to its users. Additional permissions should be obtained from the applicable author or publisher of the image. Full text @ Front Nutr