
- Title
-
Identification of a wide spectrum of ciliary gene mutations in nonsyndromic biliary atresia patients implicates ciliary dysfunction as a novel disease mechanism
- Authors
- Lam, W.Y., Tang, C.S., So, M.T., Yue, H., Hsu, J.S., Chung, P.H., Nicholls, J.M., Yeung, F., Lee, C.D., Ngo, D.N., Nguyen, P.A.H., Mitchison, H.M., Jenkins, D., O'Callaghan, C., Garcia-Barceló, M.M., Lee, S.L., Sham, P.C., Lui, V.C., Tam, P.K.
- Source
- Full text @ EBioMedicine

Fig. 1. Absence of cilia staining in the bile ducts of BA livers of the two patients harboring LOF mutations in the ciliary genes. Co-immunofluorescence staining for α-Tubulin (TUB; red) and Pericentrin (PCNT; green) was performed on liver sections of Non-BA control (Non-BA CTRL; top left), BA patients with no ciliary gene mutation (Non-mutant BA; bottom left) and BA patients with ciliary gene mutation (Mutant BA; BA650C and BA634C; top and bottom right). α-Tubulin immuno-reactivity was co-localised with PCNT at the luminal surface of the bile ducts of Non-BA CTRL and Non-mutant BA livers. In contrast, only immuno-staining for PCNT were detected but expression of α-Tubulin were absent in BA650C and BA634C patients’ bile ducts. Nuclei were stained with DAPI. Representative photos were shown for comparison. Highlighted regions were magnified as shown in inset. Number of patients examined in each group was indicated as “n”. (For interpretation of the references to color in this figure legend, the reader is referred to the web version of this article). |

Fig. 2. Knockdown of PCNT, KIF3B and TTC17 resulted in reduced number of cilia in cells. (a) Examination of the knockdown efficiency by siRNAs in human fibroblasts by real-time quantitative PCR assay using GAPDH as internal controls. Three independent experiments were performed and data represented as means ± standard deviation (SD). *** p < 0.0001, two-sided t-test. Cells transfected with non-specific scrambled siRNA were employed as negative controls and relative expression levels of PCNT, KIF3B and TTC17 to GAPDH in scrambled siRNA transfected cells were arbitrarily regarded as 1. (b) Effect of PCNT, KIF3B and TTC17 knockdown on cilia. Cells were transfected with siRNAs and serum-starved for 48 h, then immuno-stained for acetylated-α-tubulin (TUB; red) and pericentrin (PCNT, green). Nuclei were stained with DAPI (blue). Representative images of each of the siRNA transfection were shown. Ciliated cells (arrowheads) were abundant in scrambled siRNA transfected cells, whereas ciliated cells were scarce in siPCNT, siKIF3B and siTTC17 transfected cells. Ciliated cell and non-ciliated cells were magnified as shown as inset. (c) Percentage of ciliated cells in scrambled siRNA, siPCNT, siKIF3B and siTTC17 transfected cells was determined by counting ciliated cells and total number of cells. Two independent transfection experiments were performed for each siRNA, and over 100 cells were counted in each experiment. Data was shown as means±SD. *** p < 0.0001, one-way ANOVA, two-sided test. All scale bars = 50 µm. (For interpretation of the references to color in this figure legend, the reader is referred to the web version of this article). |
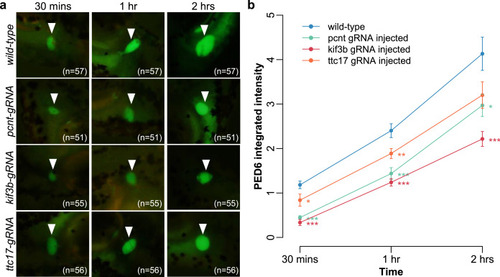
Fig. 3. Knockout of pcnt, kif3b and ttc17 resulted in defective bile flow in mutant zebrafish. (a) Representative epifluorescence images and (b) line plot of pcnt (n = 51), kif3b (n = 55) and ttc17 (n = 56) mutant embryo groups at 5 days post-fertilization showing significantly lower accumulated PED6 integrated density in gallbladder (arrowhead) after incubation for 30 min (left), 1 h (middle) and 2 h (right) compared to wild type (n = 57). Data expressed as mean ± standard error of the mean (SEM). Results of pairwise t-test: ***, P < 0.001; **, P < 0.01, *, P < 0.05. PHENOTYPE:
|

ZFIN is incorporating published figure images and captions as part of an ongoing project. Figures from some publications have not yet been curated, or are not available for display because of copyright restrictions. PHENOTYPE:
|