
- Title
-
Evaluation of the In Vitro and In Vivo Efficacy of Ruthenium Polypyridyl Compounds against Breast Cancer
- Authors
- Lenis-Rojas, O.A., Roma-Rodrigues, C., Fernandes, A.R., Carvalho, A., Cordeiro, S., Guerra-Varela, J., Sánchez, L., Vázquez-García, D., López-Torres, M., Fernández, A., Fernández, J.J.
- Source
- Full text @ Int. J. Mol. Sci.

Chemical structure of Ru(II)–polypyridyl complex TLD-1433. |

Chemical structure of Ru(II)–polypyridyl complexes Ru1 and Ru2. |

Effect of Ru2 on cellular viability of nontumor cell line fibroblasts. Cells were exposed to 0.5–100 μM of compound or 0.1% (v/v) DMSO (vehicle control) for 72 h. The results are expressed as mean ± SEM fold-change compared to controls of at least three independent experiments. |
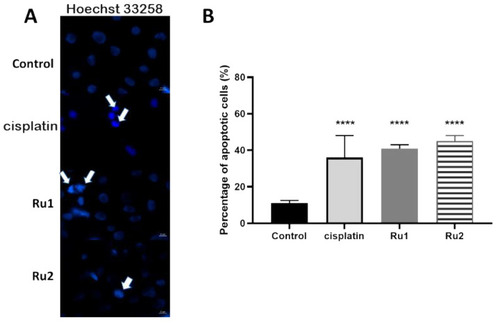
(A) Hoechst staining (excitation and fluorescence emission at 352 and 461 nm, respectively) of MCF7 cell line for visualization of apoptotic nuclei. Cells were grown in DMEM culture medium supplemented with 10% (v/v) fetal bovine serum in the presence of 0.1% (v/v) DMSO, the IC50 of cisplatin, the IC50 of Ru1, or the IC50 of Ru2 for 72 h. The arrows indicate an initial event of apoptosis such as chromatin condensation and nuclear fragmentation. The images were acquired using a ZEISS Microscope with ZEN software. (B) Percentage of apoptotic cells in MCF7 breast adenocarcinoma cell line after exposure to 0.1% (v/v) DMSO (vehicle control) or to the IC50 of each Ru(II) compound. The data are presented as the mean ± SEM of three independent experiments, and the statistical significance was evaluated in relation to the reference group (control) using the one-way ANOVA method followed by a Tukey multiple comparison test (**** p ≤ 0.0001). |

Effect of Ru1, Ru2 or 0.1% (v/v) DMSO on the cell-cycle progression of MCF7 cell line. Cells were synchronized and exposed to a 0.1% (v/v) DMSO solution (vehicle control) or the IC50 concentrations of each compound for 6 h (A) and 12 h (B). The fluorescence content was analyzed by flow cytometry, after staining with propidium iodide (PI, excitation and fluorescence emission at 493 and 636 nm, respectively). The data are presented as the mean ± SEM of three independent experiments. |

Subcellular distribution of Ru1 and Ru2 in MCF7 cell line. Cells were incubated in the presence of 60 μM of the complexes for 6 h. Data are presented as the mean ± SEM of two independent assays. |
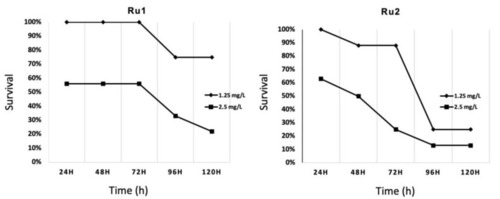
Survival evolution through time of 24 h post fertilization (hpf) zebrafish embryos exposed to ruthenium compounds at different concentrations; higher concentrations (5.0 and 10.0 mg·L−1) showed no survival at 24 h post treatment (hpt). |
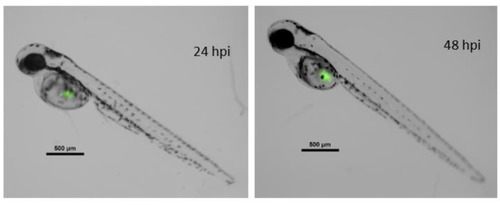
Merged composition (black/white and green fluorescence channels) of a zebrafish embryo xenografted with fluorescent MCF7 cancer line. Left image, 72 hpf zebrafish at 24 hpi. Right image, the same embryo 24 h later. hpi = hours post injection; hpf = hours post fertilization. Scale = 500 µm. |

Comparison of MCF7 tumor cell variation in zebrafish embryos in control individuals and those exposed to antitumor drugs. * p < 0.05; ** p < 0.01; ns = not significant. Bars indicate standard deviation. PHENOTYPE:
|