
- Title
-
Role of the cardiovascular system in ammonia excretion in early life stages of zebrafish (Danio rerio)
- Authors
- Wang, Y., Pasparakis, C., Grosell, M.
- Source
- Full text @ Am. J. Physiol. Regul. Integr. Comp. Physiol.
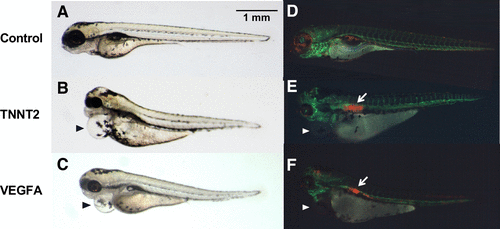
Figure 1.Effects of TNNT2 (B and E) and VEGFA (C and F) morpholino injection at 4 dpf visualized in transgenic zebrafish. A: control larvae. B and C: presence of pericardial edema (black arrowheads) are prominent. D–F: fluorescence images illustrating the effects of the mopholino injection. D: control larvae. The erythrocytes were widely distributed along the whole larvae. E and F: note the blood accumulation in the anterior aorta (white arrow) and pericardial edema (white arrowheads). dpf, days postfertilization; TNNT2, cardiac troponin T; VEGFA, vascular endothelial growth factor A. |
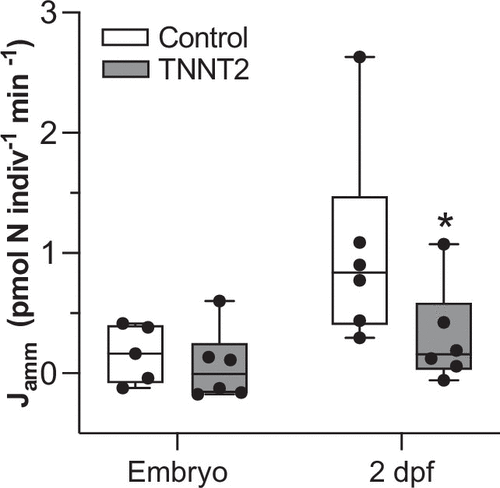
Figure 2.Ammonia excretion rates for control and TNNT2 morphants at the embryonic stage (30–36 hpf) and larval stage (2 dpf). *Significant differences between groups as analyzed using a Mann–Whitney rank-sum test. n = 5 or 6 for each replicate, which contains either 35 embryos or 15 larvae (P < 0.05). dpf, days postfertilization; hpf, hours postfertilization; TNNT2, cardiac troponin T. |
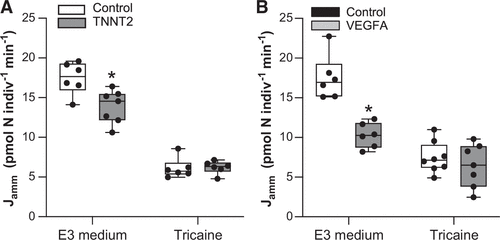
Figure 3.Ammonia excretion rates for control and TNNT2 (A) or VEGFA (B) morphant larvae in E3 medium or tricaine at 4 dpf. *Significant differences between groups as analyzed using a two-way ANOVA followed by a Holm–Sidak post hoc test. n = 6–8 with each replicate containing 10 larvae (P < 0.05). dpf, days postfertilization; TNNT2, cardiac troponin T; VEGFA, vascular endothelial growth factor A. |
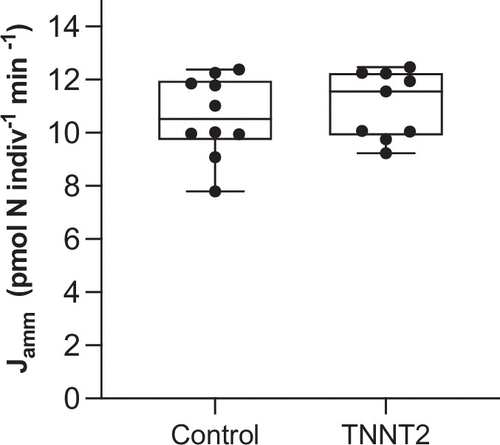
Figure 4.Ammonia excretion rates for control and TNNT2 in clove oil at 4 dpf. Data were analyzed using a Student’s t test. n = 9 or 10 with each replicate containing 10 larvae (P < 0.05). dpf, days postfertilization; TNNT2, cardiac troponin T. |
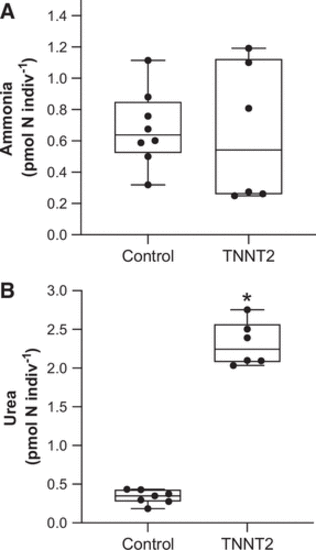
Figure 5.Whole body ammonia (A) and urea (B) concentrations for control and TNNT2 at 4 dpf. Ammonia tissue concentrations were analyzed using a Mann–Whitney rank-sum test. Urea tissue concentrations were analyzed using a Student’s t test. n = 6–8 with each replicate containing 40–60 larvae (P < 0.05). dpf, days postfertilization; TNNT2, cardiac troponin T. |
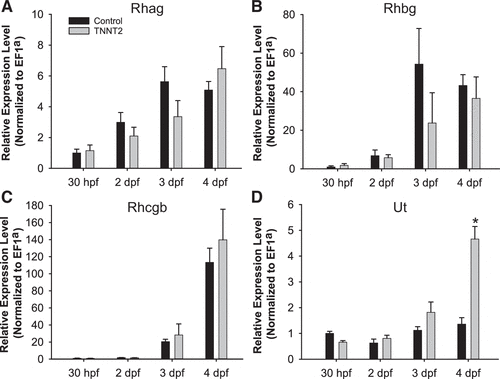
Figure 6.Relative mRNA expression levels of rhag (A), rhbg (B), rhcgb (C), and ut (D) genes in control and TNNT2 morphant zebrafish during the development. Expression values were given relative to the amount of the gene at 30 hpf in the control zebrafish. *Significant differences between groups as analyzed using a two-way ANOVA followed by a Holm–Sidak post hoc test. n = 4 with each replicate representing 20–30 embryos or larvae (P < 0.05). hpf, hours postfertilization; TNNT2, cardiac troponin T. |
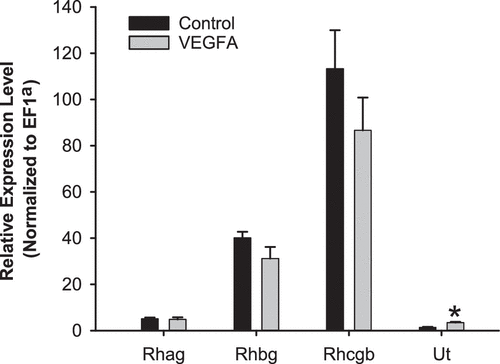
Figure 7.Relative mRNA expression levels of rhag, rhbg, rhcgb, and ut genes in control and VEGFA morphant zebrafish at 4 dpf. Expression values were given relative to the amount of the gene at 30 hpf in the control zebrafish. *Significant differences between groups as analyzed using a Student’s t test. n = 4 with each replicate representing 20–30 embryos or larvae (P < 0.05). dpf, days postfertilization; hpf, hours postfertilization; VEGFA, vascular endothelial growth factor A. |
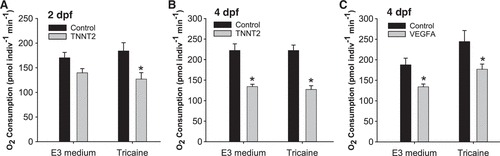
Figure 8.Oxygen consumption rates at 2 dpf (A) and 4 dpf (B and C) in control and morphant zebrafish. Data are presented as means ± SE. *Significant differences between groups. Oxygen consumption rates for control and TNNT2 (A and B) were analyzed using a one-way ANOVA followed by a Tukey post hoc test (n = 11–19; P < 0.05). Oxygen consumption rates for control and VEGFA (C) were analyzed using a Student’s t test (n = 8 or 9; P < 0.05). dpf, days postfertilization; TNNT2, cardiac troponin T; VEGFA, vascular endothelial growth factor A. |