FIGURE SUMMARY
Title

A Dietary Cholesterol-Based Intestinal Inflammation Assay for Improving Drug-Discovery on Inflammatory Bowel Diseases

Authors
Silva, N.V., Carregosa, D., Gonçalves, C., Vieira, O.V., Nunes Dos Santos, C., Jacinto, A., Crespo, C.L.
Source
Full text @ Front Cell Dev Biol

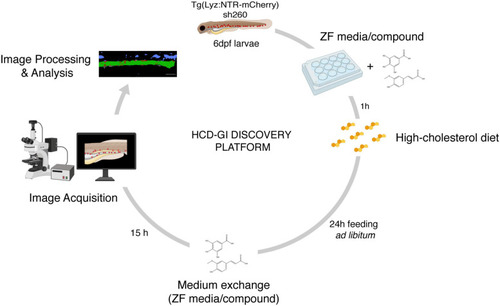
The high-cholesterol diet gut inflammation (HCD-GI) discovery platform. Schematic diagram illustrating the screening strategy for compounds modulating inflammation. Individual Tg(Lyz:NTR-mCherry)sh260 larvae, with fluorescent reporter expression in neutrophils, are distributed in 12-well plates with E3 zebrafish (ZF) medium supplemented with the compounds at 25 or 100 μM. After 1 h pre-treatment, larvae are fed with high-cholesterol diet (HCD) for 24 h. Larvae are then transferred to fresh medium supplemented with compounds were are kept for 15 h to allow inflammation and proper intestine emptying to occur. Larvae are finally fixed and imaged. Screening data are processed, and the neutrophilic inflammation index analyzed. Figure performed with images from Biorender.

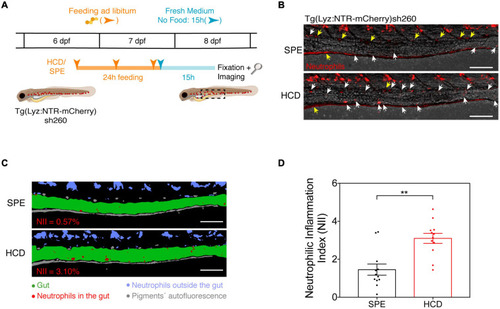
The HCD-gut inflammation (HCD-GI) assay. (A) Schematic representation of the protocol optimized for the HCD-GI assay in 6 dpf Tg(Lyz:NTR-mCherry)sh260 (Progatzky et al., 2014). (B) Representative images of distal intestine at 15 h following SPE or HCD feeding for a 24 h period. White arrows correspond to mCherry+ neutrophils in the intestines. Yellow arrows correspond to autofluorescence caused by pigments. (C) Image processing used for the quantification of neutrophilic inflammation index (NII) in larvae from (B). NII values for the representative SPE or HCD larvae are shown in red. (D) NII quantification. One representative experiment of n = 12 larvae is shown. Each dot represents one larva. Two-tailed Mann Whitney test. **P < 0.01. Error bars represent SEM. Scale bars = 100 μm. Scheme (A) performed with images from Biorender.

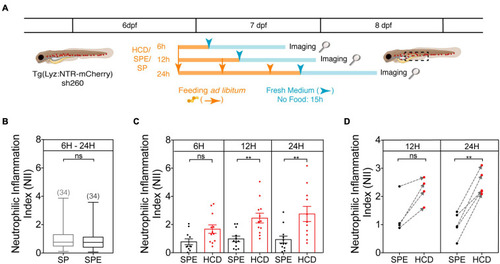
Protocol optimization for the HCD-GI assay. (A) Schematic representation of the optimization protocol used to establish the HCD-GI assay in 6 dpf Tg(Lyz:NTR-mCherry)sh260. (B) Box plots of mean neutrophilic inflammation index (NII) quantification at 15 h following feeding with standard zebrafish larval food (SP) or SP supplemented with the cholesterol solubilizer diethyl ether (SPE). Data were aggregated from one representative experiment of n = 10–12 larvae fed for 6, 12, or 24 h. Total number of averaged larvae is disclosed in parenthesis. Central lines represent median values, whereas box edges represent the 25 and 75th percentiles. (C) Neutrophilic inflammation index (NII) quantification at 15 h following HCD or control diet SPE feeding for a 6- (Progatzky et al., 2014), 12-, or 24 h period. One representative experiment of n = 10–12 larvae is shown. Each dot represents one larva. Error bars represent SEM. (D) Arrow plots of mean NII values. Mean NII of pools of n = 10–12 larvae were calculated for 4–5 independent experiments and represented by dots. SPE – Black dots; HCD – Red dots. The gray dashed arrows indicate the difference between mean NII in SPE- and HCD-fed animals in individual experiments. Two-tailed Mann Whitney test. **P < 0.01; n, non-significant. Scheme (A) performed with images from Biorender.

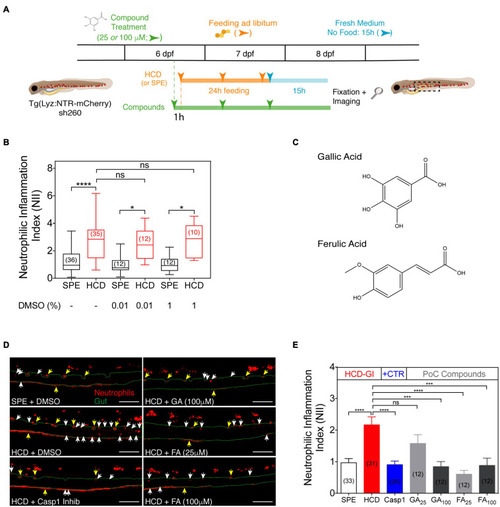
The HCD-GI discovery platform reveals an anti-inflammatory action of gallic acid (GA) and ferulic acid (FA) on zebrafish intestinal neutrophilic inflammation. (A) Schematic representation of the HCD-GI discovery platform in 6 dpf Tg(Lyz:NTR-mCherry)sh260. (B) Box plots of neutrophilic inflammation index (NII) analysis at 15 h following SPE or HCD feeding for a 24 h period in larvae untreated or treated with DMSO at different concentrations. Central lines represent median values, whereas box edges represent the 25 and 75th percentiles. Data were aggregated from 3 (DMSO: -) or 1 (DMSO: 0.01 or 1%) screening replicates and pools of n biologically independent animal experiments disclosed in parenthesis. (C) Chemical structures of GA and FA. (D) Representative images of distal intestine in GA, FA, or 1% DMSO-treated larvae. Caspase 1 Inhibitor I (Casp1) at 100 μM is used as positive anti-inflammatory control. White arrows correspond to mCherry+ neutrophils in the intestines. Yellow arrows correspond to autofluorescence caused by pigments. The intestine is outlined in green. Scale bars, 100 μm. (E) NII analysis in GA, FA, or DMSO-treated larvae. Data are presented as mean values ± SEM. Data were aggregated from 3 (SPE and HCD), 2 (Casp1), or 1 (GA and FA) screening replicates and pools of n biologically independent animal experiments disclosed in parenthesis. Kruskal–Wallis test (one-way ANOVA on ranks) was used for multiple comparisons. ****P < 0.0001; ***P < 0.001; *P < 0.05; ns, non-significant. Scheme (A) performed with images from Biorender.

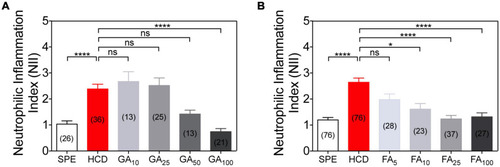
Dose-response anti-inflammatory action of gallic acid (GA) and ferulic acid (FA) using the HCD-GI assay. (A) Neutrophilic inflammation index (NII) in DMSO or GA-treated larvae. Data were aggregated from 3 (HCD), 2 (SPE, GA25, and GA100) or 1 (GA10 and GA50) experimental replicates and pools of n biologically independent animal experiments disclosed in parenthesis. (B) NII in DMSO or FA-treated larvae. Data were aggregated from 6 (SPE and HCD), 3 (FA25 and FA100) or 2 (FA5 and FA10) experimental replicates and pools of n biologically independent animal experiments disclosed in parenthesis. Data are presented as mean values ± SEM. Kruskal–Wallis test (one-way ANOVA on ranks) was used for multiple comparisons. ****P < 0.0001; *P < 0.05; ns, non-significant.

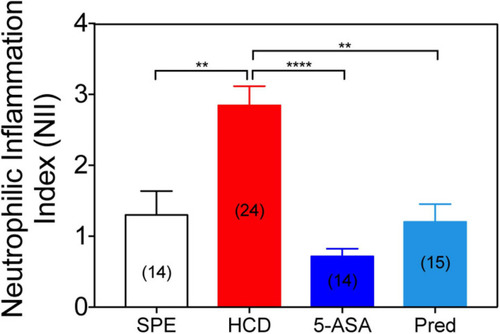
Treatment with conventional IBD therapeutics reduces the neutrophilic inflammation index. Neutrophilic inflammation index (NII) analysis in prednisolone (25 μM), mesalamine (5-ASA; 0.33 mM) or 1% DMSO-treated larvae. Data were aggregated from 2 (HCD) or 1 (SPE, Prednisolone, and 5-ASA) experimental replicates and pools of n biologically independent animal experiments disclosed in parenthesis. Data are presented as mean values ± SEM. Kruskal–Wallis test (one-way ANOVA on ranks) was used for multiple comparisons. ****P < 0.0001; **P < 0.01; ns, non-significant.

Acknowledgments
This image is the copyrighted work of the attributed author or publisher, and ZFIN has permission only to display this image to its users. Additional permissions should be obtained from the applicable author or publisher of the image. Full text @ Front Cell Dev Biol