FIGURE SUMMARY
Title

A Comparative Study of Human and Zebrafish Pregnane X Receptor Activities of Pesticides and Steroids Using In Vitro Reporter Gene Assays

Authors
Creusot, N., Garoche, C., Grimaldi, M., Boulahtouf, A., Chiavarina, B., Bourguet, W., Balaguer, P.
Source
Full text @ Front Endocrinol (Lausanne)

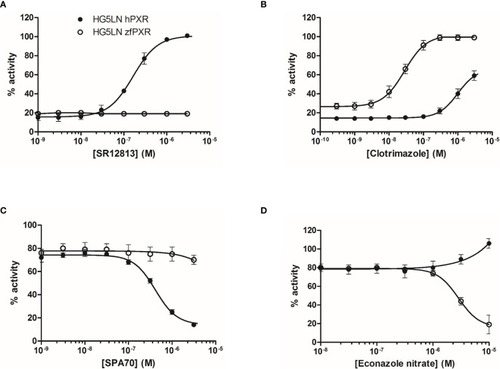
Transcriptional activity of hPXR and zfPXR in response to reference chemicals SR 12813 (A), clotrimazole (B), SPA 70 (C), and econazole nitrate (D). Results are expressed as a percentage of the maximum luciferase activity induced by 3 µM SR 12813 (HG5LN-hPXR) or 1 µM clotrimazole (HG5LN-zfPXR). Error bars represent standard deviations.

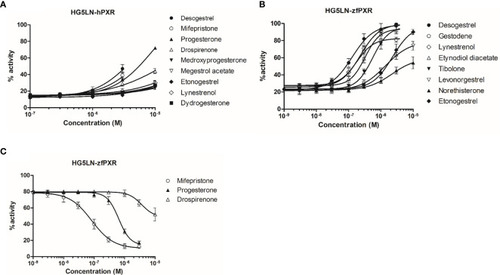
Transcriptional activity of hPXR and zfPXR in response to steroids. (A) Agonist steroids on HG5LN-hPXR; (B) Agonist steroids on HG5LN-zfPXR; (C) Antagonist steroids on HG5LN-zfPXR. Results are expressed as a percentage of the maximum luciferase activity induced by 3 µM SR 12813 (HG5LN-hPXR) or 1 µM clotrimazole (HG5LN-zfPXR). Error bars represent standard deviations.

Transcriptional activity of hPXR and zfPXR in response to the pesticides pretilachlor (A), toxaphene (B), deltamethrin (C), and cypermethrin (D). Results are expressed as a percentage of the maximum luciferase activity induced by 3 µM SR 12813 (HG5LN-hPXR) or 1 µM clotrimazole (HG5LN-zfPXR). Error bars represent standard deviations.

Transcriptional activity of zfPXR in ZFL-zfPXR cells in response to steroids and pesticides. (A) Agonist compounds clotrimazole, desogestrel, and pendimethalin; (B) Antagonist compounds mifepristone, econazole nitrate and deltamethrin. Results are expressed as a percentage of the maximum luciferase activity induced by 1 µM clotrimazole. Error bars represent standard deviations.

Structural analysis of zfPXR selectivity. A zfPXR LBD model was generated and superimposed on the crystallographic structures of hPXR LBD in complex with the reference agonist SR12813 (A) and clotrimazole (B). The ligands and side chains of hPXR residues are shown as orange sticks, while zfPXR residues are colored in green. The conserved π-trap residues in hPXR (W299, Y306) and zfPXR (W295, Y302) are displayed in light orange and light green, respectively. For clarity, only residue differences at key positions are shown.

Acknowledgments
This image is the copyrighted work of the attributed author or publisher, and ZFIN has permission only to display this image to its users. Additional permissions should be obtained from the applicable author or publisher of the image. Full text @ Front Endocrinol (Lausanne)