
- Title
-
Gonadotropin Releasing Hormone (Gnrh) Triggers Neurogenesis in the Hypothalamus of Adult Zebrafish
- Authors
- Ceriani, R., Whitlock, K.E.
- Source
- Full text @ Int. J. Mol. Sci.
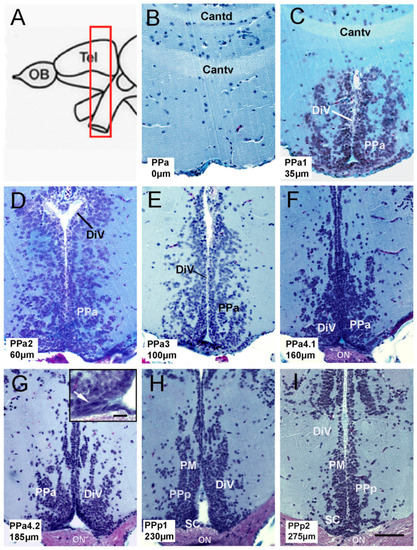
Anatomy of the preoptic area (POA) in adult zebrafish. (A) Schematic representation of zebrafish brain. The red, boxed area indicates the POA region. (B–I) Transverse paraffin sections of the POA stained using trichrome stain. POA region starts from the commis-sure anterior to the optic chiasm. Each slice corresponds to the representative region of the POA, categorized with a code: PPa0, PPa1, PPa2, PPa3, PPa4.1, PPa4.2, PPp1, and PPp2, where the numbers indicate the distance in μm from the beginning of the POA. (G) Cells with a fusiform nucleus are observed in the ventral region of the PPa (arrow in the boxed area). Commissure, pars dorsalis (Cantd); anterior commissure, pars ventralis (Cantv); diencephalic ventricle (DiV); anterior part of the parvocellular preoptic nucleus (PPa); posterior part of the parvocellular nucleus (PPp); optic nerve (ON); suprachiasmatic nucleus (SC); magnocellular nucleus (PM). Scale bar: (I) 50 μm, (G) in r.ectang.le 10 μm. |
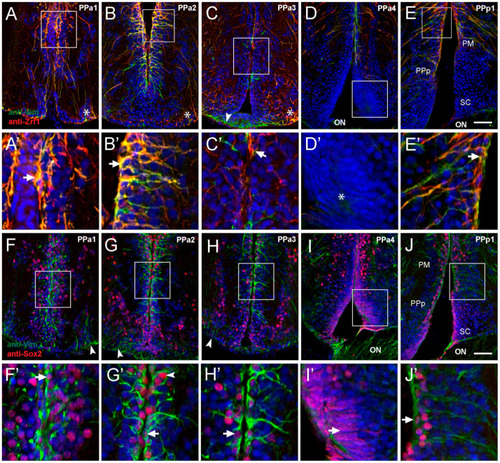
Cells lining the diencephalic ventricle (DiV) express neural progenitor markers. (A–J) Expression of Vim, Zrf1, and Sox2 in transverse paraffin-sections of 10 μm of the POA. (A–E) Cells immuno-positive for anti-Vim (red) and anti-Zrf1 (green). (A,B) Vim+/Zrf1+ positive cells are distributed dorsomedially in the wall of the third ventricle (boxed area), and signals are co-localized ((A’,B’), arrows). (C) Fewer Vim+/Zrf1+ cells are observed in PPa3 (boxed area) with limited co-localization ((C’), arrow). ((A–C), asterisks) Vim+/Zrf1+ cells are located in the ventrolateral region with long processes that extend towards the DiV (arrowheads). (D) Vim-/Zrf1- cells with fusiform nuclei are found in at ventral sur-face of POA ((D’), asterisk). (E) Vim+ and Zrf1+ label in dorsomedial region (boxed area), is co-localized ((E’), arrow). (F–J) Cells immune-positive for anti-Vim and anti-Sox2. (F–H) Vim+ cells also label with anti-Sox2 (red) (boxed area), and Sox2+ cells are observed in dorsal-ventral regions of the ventricle wall. (F’–H’) Higher magnification views of box areas in F-H: Vim+/Sox2+ co-localization in cells (arrows). (I) Cells with fusiform nuclei are Sox2+ and are located in the ventral wall ((I’), arrow). (J) Vim+ and Sox2+ boxed area, co-localize in ventricle wall ((J’), arrow). Diencephalic ventricle (DiV); magnocellular nucleus (PM); optic nerve (ON); anterior part of the parvocellular preoptic nucleus (PPa); posterior part parvocellular nucleus (PPp); suprachiasmatic nucleus (SC). All sections labeled with DAPI (blue). Scale bar: 30 μm. |

Cytoplasmic Sox2 cells co-localize with Fezf2:GFP. (A–F) Transverse cryosections of 20 µm of PPp1. (A–C) Large cytoplasmic Sox2+ cells express Fezf2:GFP (arrow), smaller cells Fezf2:GFP do not co-localize with cytoplasmic Sox2 (arrowheads). (A) Anti-Sox2 labeling. (B) Fezf2:GFP expression. (C) Merged image. Confocal images of (D) Sox2+ cells (E) Fezf2:GFP+ cells, (F) Merge. Cytoplasmic Sox2+ cells (red, arrow) express Fezf2:GFP (green, arrow), Small Fezf2:GFP+ cells (green, arrowhead) are Sox2 ((D,F) arrowheads). Sections labeled with DAPI (blue). Diencephalic ventricle (DiV). Scale bar: 30 μm. |

Proliferating cell nuclear antigen (PCNA) is located primarily in the PPa4/PPp1 transition region. (A–J) Transverse paraffin-sections of 5 µm of POA. (A–E) Vim+ cells (green) are localized to the dorsal region of the POA, in contrast, PCNA+ cells (red, arrow (B,C,E)) are found in the ventral of the POA. Vim+ labeling ((D’,D’’’), green) does not co-localize with anti-PCNA labeling ((D’’,D’’’), red). (F–H) Many Sox2+ cells (green) were observed in PPa1-3 and PPp1 (J) with few PCNA+ cells (red, arrows). (I) Sox2+ cells (green) and PCNA+ (red) in the ventral PPa4 region of the POA (boxed area) where the signals were co-localized in some cells ((I’–I’’’), arrowheads). All sections were labeled with DAPI (blue). Scale bar: 30 μm. |

POA generates new cells with 8-day pulse-chase labeling. (A–J) BrdU/PCNA double immunofluorescence in transverse paraffin sections of 5 µm. (A–E) Treatment with one pulse of BrdU on day 1 and brains fixed on the second day. (F–J). Treatment with two pulses of BrdU at 1 and 7 days, and brains were fixed at day 8. All sections were labeled with DAPI (blue). Scale bar: 30 μm. (K,M) Percentage of cells double or single labeled for BrdU or PCNA located in the POA, with single-BrdU pulse on day 1 (K) and two BrdU pulses at 1 and 7 days (M). (L,N) Percentage of cells double or single labeled for BrdU or PCNA in representative sections of the POA with single-BrdU pulse on day 1 (L) and two BrdU pulses at 1 and 7 days (N). For each representative region of the POA, the number of sections (L) (PPa1 = 5, PPa2 = 10, PPa3 = 13, PPa4 = 12, and PPp1 = 4) and (N) (PPa1 = 5, PPa2 = 10, PPa3 = 13, PPa4 = 12, and PPp1 = 4) labeled, BrdU+, PCNA+ and BrdU+/PCNA+ cells were counted. Graphs plotted with SEM. |

The majority of Zrf1 positive cells are non-proliferative and do not incorporate BrdU. (A–F) anti-BrdU/anti-Zrf1 double immunofluorescence in transverse cryosection of 20 µm of the POA. Treatment with two pulses of BrdU at 1 and 7 days, and the brains were fixed at 8 days. Zrf1+ tanycytes (red), generally do not express BrdU (green), but a low number of Zrf1+ cells are BrdU+ ((B), magnified image of boxed). All sections were labeled with DAPI (blue). Scale bar: 30 μm. (G) Percentage of BrdU+, Zrf1+, and Zrf1+/BrdU+ cells distributed in the wall of the DiV of the POA. The cell count was obtained of the total immune-labeling cells of the POA. (H) Percentage of BrdU+, Zrf1+, and BrdU+/Zrf1+ cells are located in representative sections of the POA (PPa1 = 2, PPa2 = 2, PPa3 = 2, PPa4 = 3 and PPp1 = 2) where BrdU+, Zrf1+, and Zrf1+/BrdU+ cells were counted. |
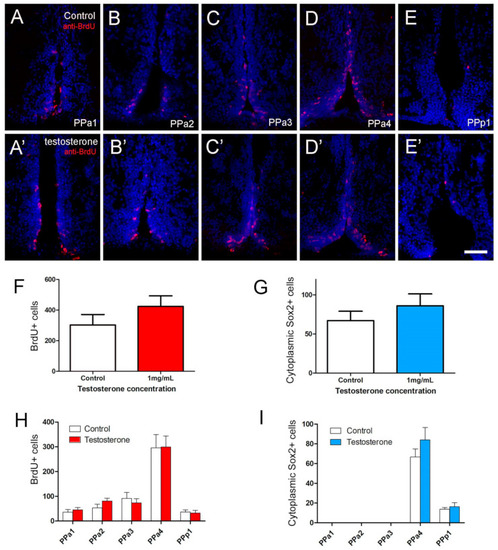
Testosterone did not affect cell proliferation in the POA. (A–E,A’–E’) Quantification of the effects of testosterone (1 mg/mL) in POA of adult zebrafish. The number of cells was counted in transverse 20 µm cryosections of the POA (12 sections). (A–E) Testosterone control. (A’–E’) Testosterone treatment (1 mg/mL). (F) Number of BrdU+ cells. (G) Number of cytoplasmic Sox2+ cells. (H,I) Number of cells located in the regions of the POA (20 µm: PPa1 = 2, PPa2 = 2, PPa3 = 3, PPa4 = 4 and PPp1 = 2). All sections were labeled with DAPI (blue). Scale bar: 30 μm. |
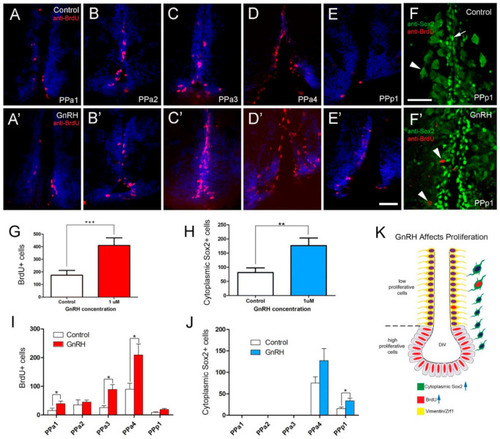
BrdU labeling reveals GnRH-induced increases in cells in the POA. (A–E,A’–E’) Quantification of the effects of GnRH (1 µM GnRH) on the POA of adult zebrafish: Cells were counted in transverse 20 µm cryosections of the POA (12 sections). (A–E) GnRH control. (A–E’) GnRH treatment (1 µM GnRH). (F) Control with Sox2+ cells (arrow), cytoplasmic Sox2+ (arrowhead) (F’) GnRH treatment increased cytoplasmic Sox2+ cells in the PPp1 (arrowheads). (G) Significant increases in BrdU labeled cells in the GnRH-treated animals. (H) Significant increases in cytoplasmic Sox2+ cells increased in the GnRH-treated animals. *** p < 0.001; ** p < 0.01; Student’s t-test, SEM. (I,J) Number of cells located in the regions of the POA scored in transverse cryosections (20 µm: PPa1 = 2, PPa2 = 2, PPa3 = 3, PPa4 = 4 and PPp1 = 2). (I) Number of BrdU+ cells (J) number of cytoplasmic Sox2+ cells in GnRH-treated animals. * p < 0.05, Student’s t-test, SEM. (K) GnRH treatment increased the number of BrdU+ cells (blue arrow) and cytoplasmic Sox2+ (blue arrow) cells, where few cytoplasmic Sox2+ were also BrdU+. (A–E,A’–E’): Sections labeled with DAPI (blue). Scale bars: 30 μm. |

Summary of the distribution of neural progenitors in the POA. (A) Distribution of neural progenitors lining the DiV in the hypothalamus of mammals according to [17]. α2 tanycytes with proliferative capacity express: Vim, Nestin [34], Sox2, and GFAP, while the non-proliferative tanycytes do not express GFAP. Ependymal cells are distributed in the dorsal region. (B) In zebrafish, we described a low-proliferative cell Vim+, Sox2+, and Zrf1+, and high proliferative Sox2+ cells, previously reported to express nestin [42]. Cytoplasmic Sox2/Fezf2:GFP cells were observed in the region previously shown to express cytoplasmic Sox2 [29]. (C) Cytokeratin cells are express in the ventral region of the POA in cytokeratin [43] positive ependymal-like cells similar to those seen in mammals. |