
- Title
-
Compromised N-Glycosylation Processing of Kv3.1b Correlates with Perturbed Motor Neuron Structure and Locomotor Activity
- Authors
- Issa, F.A., Hall, M.K., Hatchett, C.J., Weidner, D.A., Fiorenza, A.C., Schwalbe, R.A.
- Source
- Full text @ Biology (Basel)
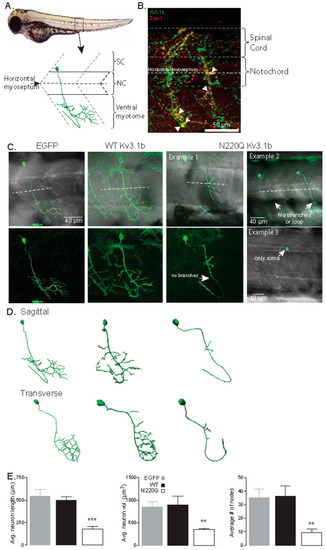
N-Glycosylation occupancy of Kv3.1b alters its spatial arrangement in motor neurons. (A) Schematic of a spinal hemi-segment illustrating the morphological innervation of the caudal primary motor neuron (CaP) of the ventral musculature. (B) A confocal projection (~40 µm stack) of one spinal hemi-segment illustrating the IHC co-staining of the Kv3.1b channel (Alexa Fluor 488, green) and Znp-1 (Alexa Fluor 555, red) in a CaP motor neuron. Arrowheads denote over-lapping expression of Kv3.1b and Znp-1. (C) Confocal projections of CaP neurons expressing EGFP, WT and N220Q Kv3.1b proteins. The bottom row shows confocal images, and top row images are overlaid with transmitted images to show the horizontal myoseptum (dashed line). (D) 3D digital rendering of the reconstructed neurons of images in (C) shown in both sagittal and transverse orientation. (E) Average axonal length, neuron axonal volume and number of nodes of CaP neurons expressing EGFP (n = 12), WT (n = 10) and N220Q (n = 11) Kv3.1b proteins. Graphs denote mean ± SEM and were compared by one-way ANOVA followed by Kruskal-Wallis adjustment (** p < 0.0005, *** p < 0.0001). See also Movies Figures S1–S3. |
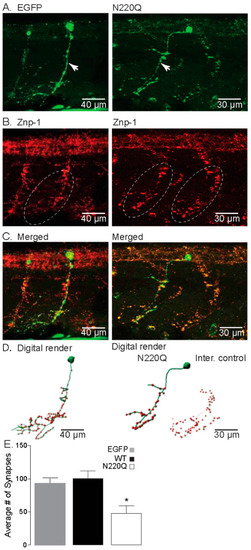
N-Glycosylation processing of the Kv3.1b protein impacts motor neuron development in zebrafish. (A) Confocal images of IHC staining of CaP neurons expressing either EGFP (left) or N220Q Kv3.1b (right) from 48 hpf embryos. Arrows denote main axonal branches. (B) Co-staining of Znp-1 highlights the extensive synapse points in the ventral myotome (dashed line oval). (C) Merged confocal projections from parts A and B, illustrating the lack of branches and lowered synapse numbers of CaP neurons expressing the N220Q Kv3.1b compared to EGFP alone or internal control. (D) Digital rendering of neuron morphology (green) and synaptic points (red) from part C, showing the extensive axonal branching of EGFP expressing neurons and internal control and high synaptic points compared to the CaP neuron expressing the N220Q Kv3.1b. (E) Average number of synapses of CaP neurons expressing EGFP (n = 10), WT (n = 8) and N220Q (n = 9) Kv3.1b proteins. Graphs denote mean ± SEM and were compared by Student’s t-test (* p < 0.0087). See also Movies Figures S4 and S5. |
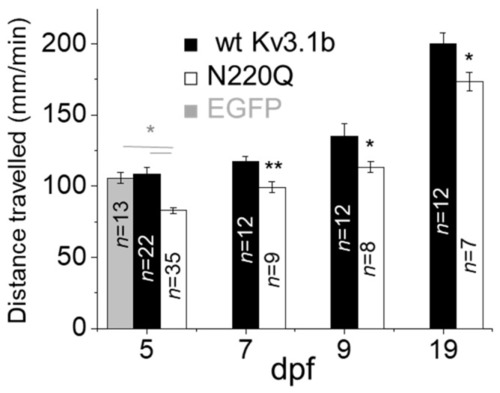
N-Glycosylation site vacancy of Kv3.1b retards motor activity in zebrafish. Average distance travelled per minute of larvae expressing EGFP, WT Kv3.1b or N220Q Kv3.1b in CaP neurons. Data are presented as the mean ± SEM and were compared by one-way ANOVA (* p < 0.01) and Student’s t-test (* p < 0.05, ** p < 0.01) for groups of more than two or two, respectively. |
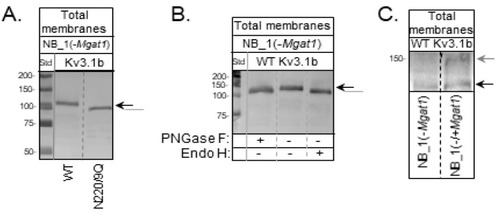
Immunoblot of Kv3.1b stable expressed in GnT-I knockout NB cells. (A) A Western blot of glycosylated (WT) and unglycosylated (N220/229Q) Kv3.1b proteins in total membranes from stably transfected NB_1(-Mgat1) cells. (B) A Western blot of total membrane proteins from NB_1(-Mgat1) cells stably expressing WT Kv3.1b digested (+) and undigested (−) with PNGase F and Endo H. (C) A Western blot of Kv3.1b from NB_1 (−Mgat1) cells stably expressing WT Kv3.1b compared to those cells transiently transfected with GnT-I. Molecular weight standards in kDa: 250; 150; 100; 75; 50; and 37 from top to bottom. Black and grey arrows denote Kv3.1b glycoprotein with oligomannose and complex types of N-glycans, respectively. The grey line signifies unglycosylated Kv3.1 protein. See also Figures S6–S8. |

N-Glycosylation processing modified the spatial arrangement of Kv3.1b protein-containing particles in subdomains of the cell membrane. Representative micrographs of glycosylated (WT) (A) and unglycosylated (N220/229Q) (B) Kv3.1b proteins expressed in NB_1(-Mgat1) (left panels) and control (right panels) cells acquired in TIRF (upper panels), DIC (middle panels) and wide-field (lower panels) modes. Representative scale bar (5 μM) was similar for all acquired images. The dashed circle denotes the cell body and the projections from the cell body represent the outgrowths. (C) Percent fluorescence in the outgrowth of parental and N-glycosylation mutant cells lines stably expressing glycosylated (WT) and unglycosylated (N220/229Q) Kv3.1b proteins. Data are presented as the mean ± SEM and were compared by one-way ANOVA (* p < 0.03). n represents the number of cells analyzed. (D) Number (top panel), area (middle panel) and mean intensity (bottom panel) of particles in cell body and outgrowth of NB_1(-Mgat1) and control (NB_1) cell lines expressing glycosylated (WT) and unglycosylated (N220/229Q) Kv3.1b proteins. Insets represent differences in the particle parameters due the type of N-glycan attached to the Kv3.1 protein in cell body and outgrowth. Graphs denote mean ± SEM and were compared by Student’s t-test (p < 0.05). (*) denotes a comparison between glycosylated and unglycosylated Kv3.1b in the same cell line and (*) represents a comparison between either glycosylated or unglycosylated Kv3.1b a cell line. n denotes the number of particles examined. |
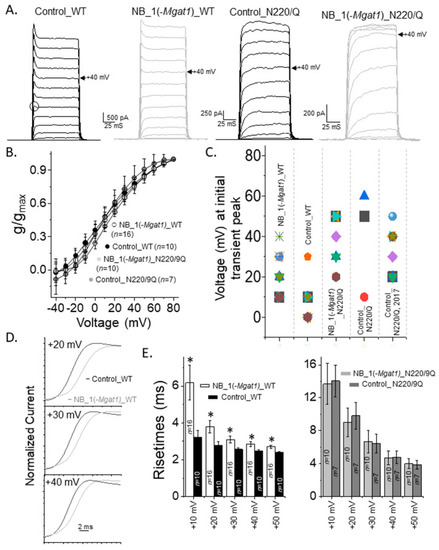
Opening rate of outward ionic current decreased as N-glycan branching is lessened. (A) Activation currents were elicited by holding cells at −50 mV and stepping from −40 mV to +80 mV in 10 mV increments for 100 ms. Whole cell currents were acquired for glycosylated Kv3.1b expressed in parental (Control_WT) and glycosylated mutant (NB_1(-Mgat1)_WT) cells and unglycosylated Kv3.1 in the mutant cell line (NB_1(-Mgat1)_N220/229Q). Open circle denotes transient peak at +10 mV. Control cell line is the parental cell lines, NB_1. Arrow points to current recorded at +40 mV. (B) Conductance-voltage (g/gmax) curves obtained from non-inactivating currents with and without transient peaks expressed by glycosylated (WT) and unglycosylated (N220/229Q) Kv3.1b in NB_1 and NB_1(-Mgat1). (C) Scatter plot illustrating voltage at which the initial transient peak was observed from non-inactivating current with transient peaks of the various cell lines and those from our past reports [16]. (D) Whole cell currents from activation voltage protocols in (A) were expanded for Control_WT and NB_1(-Mgat1)_WT cells lines. (E) Rise times of activation currents of the WT Kv3.1 (left panel) and N220/229Q (right panel) expressing cell lines. Data are presented as the mean ± SEM and were compared by Student’s t-test (* p < 0.05). |
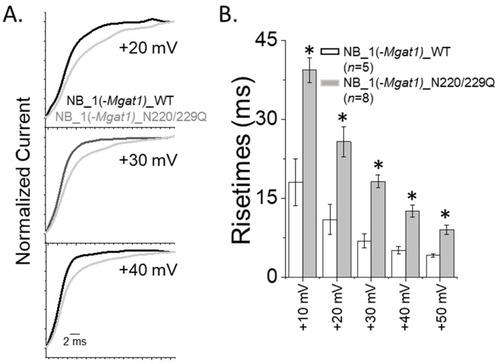
Delayed opening rates of inactivating currents with altered N-glycan branching. (A) Whole cell currents of inactivating current were expanded for NB_1(-Mgat1)_WT and NB_1(-Mgat1)_DM cells lines. (B) Rise times obtained from inactivating currents of NB_1(-Mgat1)_WT and NB_1(-Mgat1)_DM expressing cells. Data are presented as the mean ± SEM and were compared by Student’s t-test (* p < 0.05). |
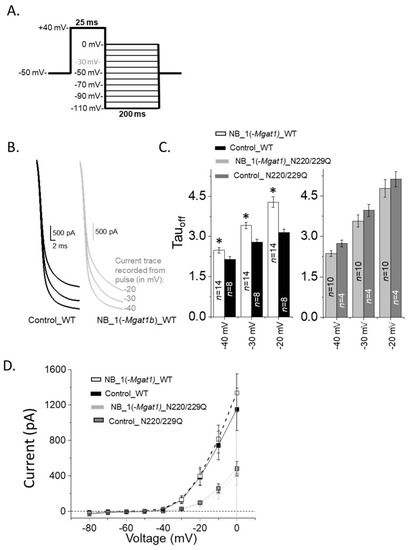
Closing rate of outward ionic current decreased as N-Glycan branching is lessened. (A) A deactivation protocol (left panel) was used to elicit whole currents (right panel) in NB cells stably expressing various forms of the Kv3.1b protein. (B) Expansion of deactivation currents at −40, −30 and −20 mV for glycosylated Kv3.1b expressed in parental (Control_WT) and glycosylated mutant (NB_1(-Mgat1)_WT) cells. (C) Deactivation time constants (Tauoff) of deactivation currents from WT Kv3.1 (left panel) and N220/229Q (right panel) expressing cell lines. (D) Current–voltage curves were obtained from the tail currents of the deactivation protocol for glycosylated (WT) and unglycosylated (N220/229Q) Kv3.1 α-subunits expressed in NB_1 and NB_1(-Mgat1). Data are presented as the mean ± SEM and were compared by Student’s t-test (* p < 0.05). |