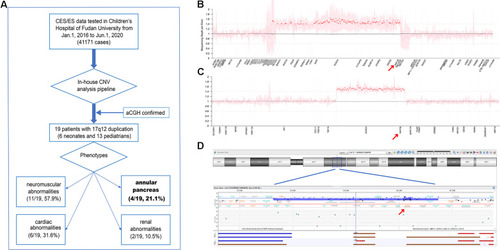
(A) Flow diagram of this study. (B,C) Normalized sequencing depth of exons in samples with 17q12 duplication, for exome sequencing (ES) (B) and clinical exome sequencing (CES) (C) samples, separately. Sequencing reads depth on each exon were normalized and summarized. The mean values were marked as dots (pink dots for normal regions and red dots for duplication regions), and 95% confidential interval was shown as pink shades. X-axis was re-scaled by exon numbers other than gene length. (D) 17q12 duplication verified in patient 5 by aCGH.
(A) Different features of zebrafish in the HNF1B overexpression group and the control group. (B) The ratio of zebrafish with abnormal pancreas in the HNF1B overexpression group and the control group. (C) The length of the pancreas in the HNF1B overexpression group and the control group.
Acknowledgments
This image is the copyrighted work of the attributed author or publisher, and
ZFIN has permission only to display this image to its users.
Additional permissions should be obtained from the applicable author or publisher of the image.
Full text @ Front Genet
Your Input Welcome
Thank you for submitting comments. Your input has been emailed to ZFIN curators who may contact you if
additional information is required.
Oops. Something went wrong. Please try again later.