FIGURE SUMMARY
Title

RNA-Seq Dataset From Isolated Leukocytes Following Spontaneous Intracerebral Hemorrhage in Zebrafish Larvae

Authors
Crilly, S., Cooper, J., Bradford, L., Prise, I.E., Krishnan, S., Kasher, P.R.
Source
Full text @ Front. Cell. Neurosci.

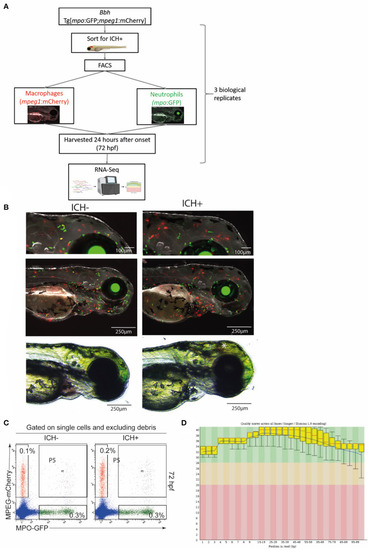
Experimental workflow and quality control steps for transcriptomic analysis. (A) Diagrammatical representation of the sample acquisition and preparation. Bbh, Bubblehead mutants; mpo, myeloperoxidase; GFP, green fluorescent protein; mpeg1, macrophage expressed gene 1; mCherry, red fluorescent protein; ICH+, hemorrhaged larvae; ICH–, non-hemorrhaged sibling controls; hpf, hours post fertilization; FACS, fluorescence-activated cell sorting; RNA-Seq, RNA sequencing. (B) Representative images of ICH– and ICH+ mpo:mpeg larvae at 72 hpf. Larvae were anesthetized briefly and images were acquired using the Leica M205 FA Stereo fluorescence microscope. Larvae were confirmed to have expression of green mpo positive neutrophils and red mpeg1 positive macrophages, and separated according to presence of ICH (*). Images at higher magnification (top panels) shows an increase in mpeg1 positive cells within the brain as previously observed. (C) Sort strategy to isolate macrophages and neutrophils from ICH+ and ICH– control zebrafish larvae at 72 hpf. From a single cell suspension, neutrophils were sorted based on their expression of GFP and macrophages by their expression of mCherry. Cells expressing both (P5) were excluded from all analyses. Numbers represent frequencies of macrophages and neutrophils as a proportion of viable cells. Plots are representative from three independent replicates. (D) FastQC plots for the quality across all bases from all 12 samples. Graphical representation of the quality for each base pair position in the reads. Green region equates to very good quality calls, orange is reasonable and red poor quality. Box plots show the median value and interquartile range, whiskers include 10 and 90% points. Blue line is overall mean quality.

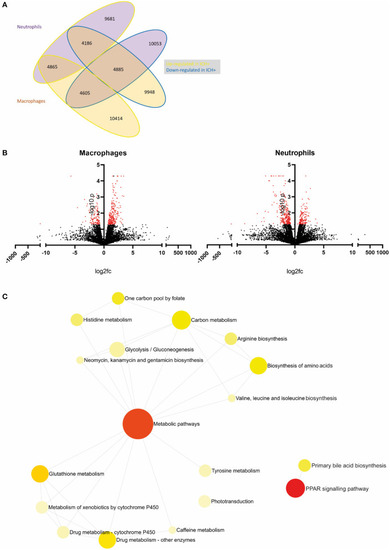
An example of primary analysis suggests metabolic pathways are dysregulated in leukocytes following ICH in zebrafish larvae. (A) Summary of gene expression across leukocyte samples in response to hemorrhage. Values outlined in yellow are upregulated and those outlined in blue are downregulated in hemorrhage. Values of genes expressed in neutrophils are in purple bubbles and those in macrophages are in orange bubbles. (B) Volcano plots showing the log2 fold change of gene expression in macrophages (left panel) and neutrophils (right panel) when compared to ICH– samples. Significant genes (p < 0.05, log10 > 1.3) are in red. (C) Network analysis reveals dysregulation in metabolic pathways in leukocytes following ICH. Metabolic pathways and PPAR signaling pathway pAdj = 0.004.

Acknowledgments
This image is the copyrighted work of the attributed author or publisher, and ZFIN has permission only to display this image to its users. Additional permissions should be obtained from the applicable author or publisher of the image. Full text @ Front. Cell. Neurosci.