
- Title
-
From Stripes to a Beating Heart: Early Cardiac Development in Zebrafish
- Authors
- Kemmler, C.L., Riemslagh, F.W., Moran, H.R., Mosimann, C.
- Source
- Full text @ J Cardiovasc Dev Dis
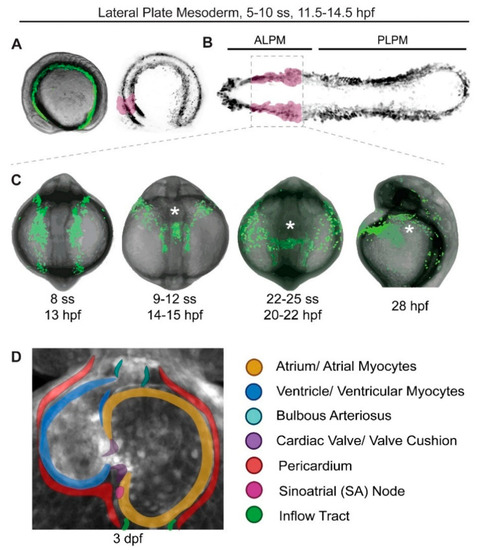
Earliest stages of cardiac development in zebrafish. Stages of zebrafish heart formation from lateral plate mesoderm (LPM). (A,B) LPM during early somitogenesis on three-dimensional (A) and virtually flat-mounted (B) zebrafish embryo, anterior to the left. The prospective bilateral heart field is marked in magenta within the anterior LPM (ALPM). (C) Stages of heart field convergence at the midline, formation of the cardiac disc and cone, migration to the left, and early heart tube stages; maximal projection of z-stack of drl:EGFP transgenics [24], anterior (head) to the top, with the embryo curved over the yolk at this stage (tail end behind the yolk in the first three panels, out of view in the right-most panel). Note how the bilateral ALPM migrates to the midline and forms the leftward-moving heart tube (asterisks). (D) 72 hpf (3 dpf) zebrafish heart with all major parts color-coded, anterior/rostral to the top; greyscale max projection of z-stack of ubi:Zebrabow transgenics overlaid with annotation of individual structures [25]. See text for details, images not to scale. |
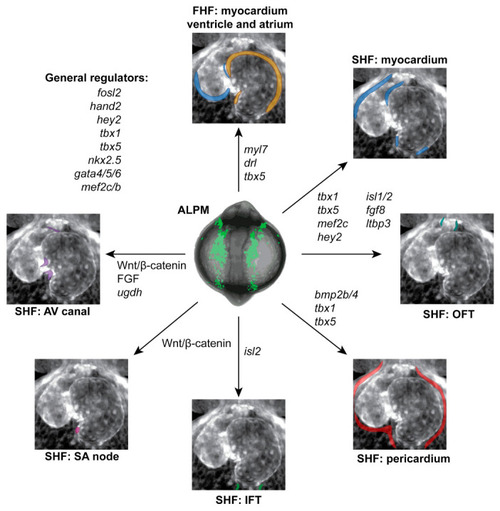
Genes contributing to early heart development in zebrafish. Overview of select genes and pathways involved in the formation and patterning of individual structures of the zebrafish heart, as representative at 3 dpf. Individual parts of the heart are color-coded corresponding to Figure 1. See text for details. |

Zebrafish as discovery platform for congenital heart disease genes. General workflow for linking patient mutations to cardiac phenotypes using zebrafish. (A) Whole-genome sequencing or other approaches inform about possible candidate genes responsible for congenital heart anomalies. (B) CRISPR-Cas9-based mutagenesis of the candidate genes by microinjection enables the generation of germline mutations towards isolating mutant alleles, as well as first phenotype assessment and screening in F0 embryos (crispants). (C) Establishment of germline mutants for subsequent genetic follow-up of phenotypic consequences of candidate mutations. (D) Phenotype assessment of crispants or germline mutants via microscopy, assisted by transgenic labeling or staining for individual gene expression patterns (i.e., mRNA in situ hybridization, immunohistochemistry, and others). The fluorescent panel is a max projection of a triple transgenic zebrafish at 3 dpf carrying drl:EGFP, myl7:CFP, and lmo2:dsRed [24,88,198,199]. See text for details. Schematics generated with BioRender. |