FIGURE SUMMARY
Title

Ion channel profiling of the Lymnaea stagnalis ganglia via transcriptome analysis

Authors
Dong, N., Bandura, J., Zhang, Z., Wang, Y., Labadie, K., Noel, B., Davison, A., Koene, J.M., Sun, H.S., Coutellec, M.A., Feng, Z.P.
Source
Full text @ BMC Genomics

Workflow of quality control, assembly and prediction of protein-coding transcripts in the L. stagnalis CNS

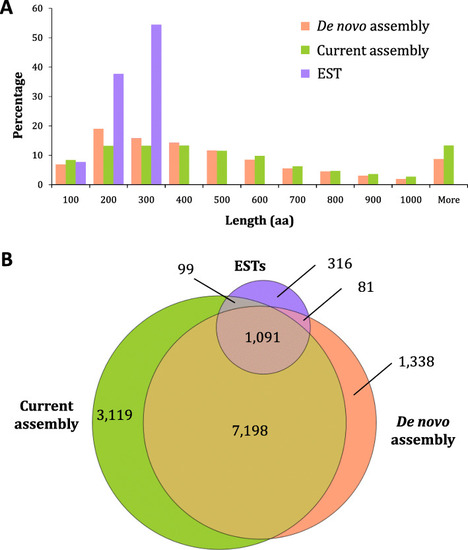
Comparison of predicted L. stagnalis protein-coding transcripts identified in the current assembly with those identified in the previously published EST library [49] and de novo assembly [50]. a Distribution of translated amino acid sequence lengths of predicted protein-coding transcripts as a percentage of the total number of transcripts in previous and current assemblies. The current assembly contains a greater percentage of longer transcripts than previous assemblies. b Overlapping and distinct Nr database hits found in predicted protein-coding sequences in previous and current assemblies. The current assembly defines a greater number of new and distinct hits than previous assemblies

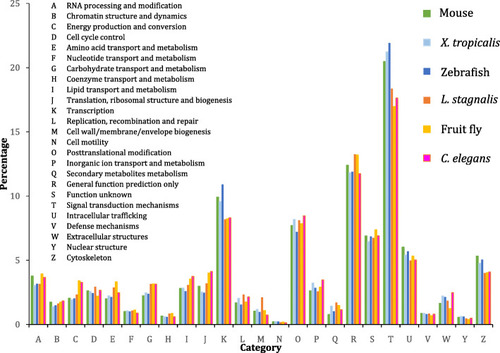
Comparison of KOG annotations of protein-coding transcripts expressed in the CNS of key vertebrate and invertebrate neuroscience model organisms (E-value <1E-5). Markedly, compared to invertebrates, vertebrate model organisms display increased percentage of transcripts involved in transcription, intracellular trafficking, and cytoskeleton. Meanwhile, compared to vertebrates, invertebrate model organisms display increased percentage of transcripts involved in energy production and conversion, amino acid transport and metabolism, carbohydrate transport and metabolism, and lipid transport and metabolism

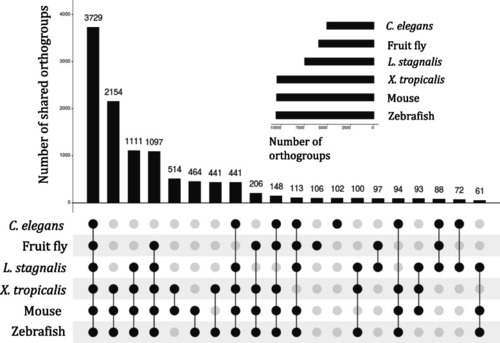
Membership of species in the orthogroups identified amongst protein-coding transcripts expressed in the CNS of M. musculus, X. tropicalis,D. rerio, L. stagnalis, D. melanogaster, and C. elegans. For clarity, only the 20 largest sets of shared orthogroups are shown. Dark and grey circles represent presence and absence, respectively, of the given species in each set of shared orthogroups. The number of orthogroups that each species is present in is shown in the inset bar graph. All species share the greatest number of orthogroups, followed by all vertebrates. Strikingly, of all three invertebrate species, L. stagnalis shares the greatest number of orthogroups with the three vertebrate species (1111)

Enriched GO terms of genes encoded by transcripts in the 3729 orthogroups shared amongst M. musculus, X. tropicalis,D. rerio, L. stagnalis, D. melanogaster, and C. elegans. Using the REVIGO tool, GO terms in the “Biological process” (a), “Cellular components” (b) and “Molecular function” (c) classes were clustered in two-dimensional space via the SimRel semantic similarity measure to summarize their relationship to each other and coloured according to their positions on the semantic x-axis. Consequently, related GO terms are closer on the plot and more similar in colour. The arbitrary semantic space units on either axis have no intrinsic meaning. Orthogroups common amongst all six organisms commonly involved a intracellular signaling pathways (red/orange), b ionotropic glutamate receptor signaling (blue), and c ion transport (red/orange), among others

Enriched GO terms of genes encoded by transcripts in the 2154 orthogroups shared amongst only M. musculus, X. tropicalis, and D. rerio. GO terms in the “Biological process” (a), “Cellular components” (b) and “Molecular function” (c) classes are clustered and coloured in the same manner as described in Fig. 5. Orthogroups unique to these vertebrates commonly involved a intercellular communication (blue/green), b plasma membrane structure (blue), and c G-protein coupled, peptide, and cytokine receptor activity (red/orange), among others

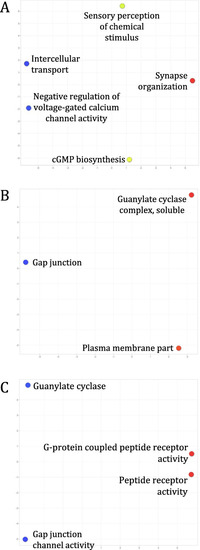
Enriched GO terms of genes encoded by transcripts in the 88 orthogroups shared amongst only L. stagnalis, D. melanogaster, and C. elegans. GO terms in the “Biological process” (a), “Cellular components” (b) and “Molecular function” (c) classes are clustered and coloured in the same manner as described in Fig. 5. Orthogroups unique to these invertebrates commonly involved a voltage-gated calcium channel activity regulation (blue), b plasma membrane structure (red), and c G-protein coupled peptide and peptide receptor activity, among others

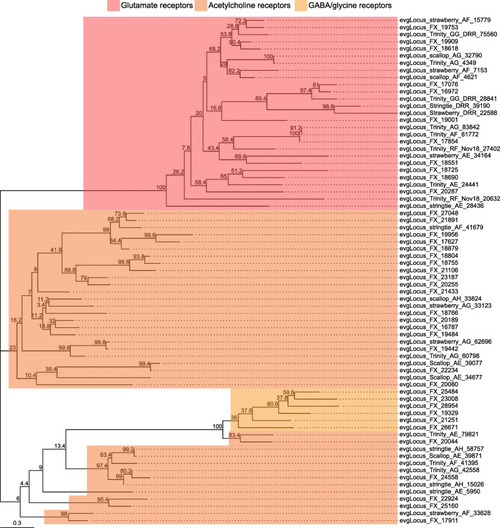
Ionotropic neurotransmitter receptor families identified in the L. stagnalis CNS transcriptome assembly. The tree with the highest log likelihood (− 7343.03) is shown. The percentage of trees in which the associated taxa clustered together (bootstrap values) is shown next to the branches. The tree is rooted at the mid-point and is drawn to scale, with branch lengths measured in the number of substitutions per site (see scale in bottom left). This analysis involved 33 amino acid sequences. There were a total of 133 positions in the final dataset. Evolutionary analyses were conducted in MEGA X (ver. 10.1.8) and tree visualization and annotation was conducted using the ggtree package (ver. 2.0.4) for R (ver. 3.6.3). This L. stagnalis transcriptome assembly identifies a wide diversity of putative acetylcholine, GABA/glycine, and glutamate receptors. The accession numbers and BLAST information of transcripts represented in this tree are provided in Tables S20, S21 and S22

K+ channel subtypes and families identified in the L. stagnalis CNS transcriptome assembly. The tree was generated as described in Fig. 8, where the analysis involved 36 amino acid sequences and yielded a total of 75 positions in the final dataset, resulting in a tree with highest log likelihood of − 4511.88. The accession numbers and BLAST information of transcripts represented in this tree are provided in Table S23. A wide diversity of putative L. stagnalis K+ channel subtypes and families are identified, including a potentially novel family of voltage-gated K+ channels (denoted by red label, #)

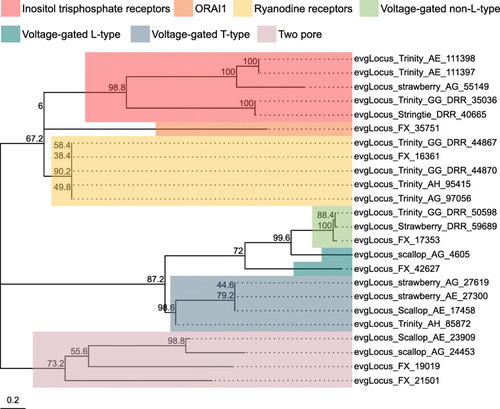
Ca2+ channel subtypes and families identified in the L. stagnalis CNS transcriptome assembly. The tree was generated as described in Fig. 8, where the analysis involved 24 amino acid sequences and yielded a total of 4018 positions in the final dataset, resulting in a tree with highest log likelihood of − 47,232.52. The accession numbers and BLAST information of transcripts represented in this tree are provided in Table S24. A diverse set of putative L. stagnalis Ca2+ channel subtypes and families are identified, including subtypes not yet cloned from L. stagnalis, such as Orai-2

Na+ channel subtypes and families identified in the L. stagnalis CNS transcriptome assembly. The tree was generated as described in Fig. 8, where the analysis involved 12 amino acid sequences and yielded a total of 345 positions in the final dataset, resulting in a tree with highest log likelihood of − 6272.64. The accession numbers and BLAST information of transcripts represented in this tree are provided in Table S25. A variety of putative L. stagnalis Na+ channel subtypes and families are identified

Cl channel subtypes and families identified in the L. stagnalis CNS transcriptome assembly. The tree was generated as described in Fig. 8, where the analysis involved 18 amino acid sequences and yielded a total of 1233 positions in the final dataset, resulting in a tree with highest log likelihood of − 22,161.37. The accession numbers and BLAST information of transcripts represented in this tree are provided in Table S26. A variety of putative L. stagnalis Cl channel subtypes and families are identified, of which anoctamin, bestrophin, and intracellular chloride channel protein have not yet been cloned from L. stagnalis

Cation channel subtypes and families identified in the L. stagnalis CNS transcriptome assembly. The tree was generated as described in Fig. 8, where the analysis involved 17 amino acid sequences and yielded a total of 8 positions in the final dataset, resulting in a tree with highest log likelihood of − 339.65. The accession numbers and BLAST information of transcripts represented in this tree are provided in Table S27. The majority of these diverse cation channels have not been cloned from L. stagnalis

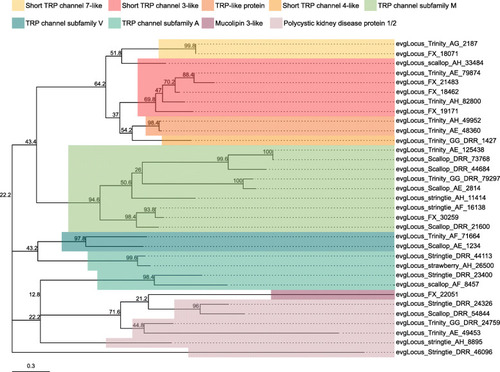
Transient receptor potential (TRP) channel subtypes and families identified in the L. stagnalis CNS transcriptome assembly. The tree was generated as described in Fig. 8, where the analysis involved 33 amino acid sequences and yielded a total of 133 positions in the final dataset, resulting in a tree with highest log likelihood of − 7343.03. The accession numbers and BLAST information of transcripts represented in this tree are provided in Table S28. This suggests a vertebrate-like diversity of TRP channels expressed by L. stagnalis

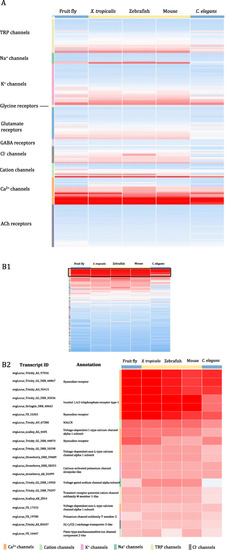
Heat maps of protein sequence similarity as measured by BLASTP bitscore between putative L. stagnalis ion channel/ionotropic receptor transcripts and homologs in mouse, X. tropicalis, zebrafish, fruit fly and C. elegans. Each bitscore is standardized by the average and standard deviation of all bitscores in the matrix. Each row corresponds to a single L. stagnalis transcript and each column to a species, such that each cell represents a standardized bitscore. Colour of each cell is proportional to the bitscore, where a darker colour indicates higher bitscore and consequently sequence similarity. A, Transcripts are sorted by the ion channel/ionotropic receptor class and species are sorted in descending order by the absolute sum of bitscores of its homologs, i.e. species with the highest bitscores across all transcripts is on the left of the heatmap. Transcripts encoding Ca2+ and cation channels appear to share the greatest sequence similarity across all six species. B1 Transcripts are sorted in descending order by the absolute sum of bitscores, i.e. transcripts with the highest sequence similarities across species are at the top of the heatmap. B2 The top 20 transcripts thus ranked are labeled by transcript ID and annotation. The colour scale is adjusted as compared to in B1 to increase contrast between cells. Interactive Clustergrammer heat map can be accessed at http://amp.pharm.mssm.edu/clustergrammer/viz/5b6ba1ca7226c37ceda3505b/LS_channel_comparisons.txt. The majority of these top 20 transcripts encode calcium channels

Acknowledgments
This image is the copyrighted work of the attributed author or publisher, and ZFIN has permission only to display this image to its users. Additional permissions should be obtained from the applicable author or publisher of the image. Full text @ BMC Genomics