
- Title
-
Age-dependent modulation of bone metabolism in zebrafish scales as new model of male osteoporosis in lower vertebrates
- Authors
- Carnovali, M., Banfi, G., Mariotti, M.
- Source
- Full text @ Geroscience
|
|

|
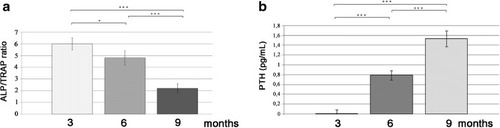
a Calculated ALP/TRAP ratio. A trend to bone resorption has been indicated by the lowering of ALP/TRAP ratio as the age increases (3 months vs 6 months, p < 0.05; 3 months vs 9 months, p < 0.001; 6 months vs 9 months, p < 0.001). b PTH level measured in fish blood showed that the hormone significantly increased with age (3 months vs 6 months, p < 0.001; 3 months vs 9 months, p < 0.001; 6 months vs 9 months, p < 0.001) |
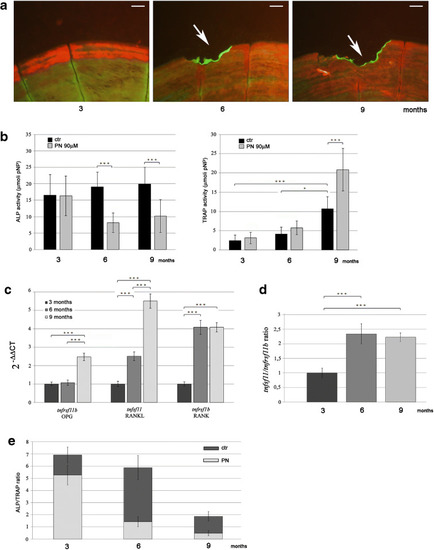
a Alizarin red/calcein live double staining of PN-treated scales from fish of different ages (scale bar = 0.1 mm). PN inhibited the formation of the new mineralized scale ring in fish of all ages and induced a significant bone resorption in 6- and 9-month-old fish scales (white arrows). b ALP and TRAP activity assay on PN-treated scales from fish of different ages. A significant reduction of ALP activity has been highlighted in 6- and 9-month-old fish treated with PN compared with untreated fish of the same age. The TRAP activity was significantly increased in PN-treated 9-month-old fish compared with earlier ages as well as with untreated fish of the same age (ALP: 6 months CTR vs 6 months PN, p < 0.001; 9 months CTR vs 9 months PN, p < 0.001; TRAP: 3 months CTR vs 9 months CTR, p < 0.001; 6 months CTR vs 9 months CTR, p < 0.05; 9 months CTR vs 9 months PN, p < 0.001). c Gene expression analysis for bone marker genes on PN-treated zebrafish scales. The expression of tnfrsf1b, tnfsf11 and tnfrsf11b (homologs of human rank, rankl and opg, respectively) was found increased in all ages after PN treatment (OPG: 3 months vs 9 months, p < 0.001; 6 months vs 9 months, p < 0.001. RANKL: 3 months vs 6 months, p < 0.001; 3 months vs 9 months, p < 0.001; 6 months vs 9 months, p < 0.001. RANK: 3 months vs 6 months, p < 0.001; 3 months vs 9 months, p < 0.001). d Calculated tnfsf11/tnfrsf11b (rankl/opg) ratio. The upregulation of tnfsf11 (human rankl) allowed the increase of the tnfsf11/tnfrsf11b (rankl/opg) ratio in 6- and 9 month-old PN-treated fish (3 months vs 6 months, p < 0.001; 3 months vs 9 months, p < 0.001). e ALP/TRAP ratio in PN-treated fish. Compared with the untreated fish, ALP/TRAP ratio decreased more rapidly during aging after PN treatment (6 months CTR vs 3 months CTR, − 15%, p < 0.05; 9 months CTR vs 3 months CTR, − 73%, p < 0.001; 9 months CTR vs 6 months CTR, − 68%, p < 0.001; 6 months PN vs 3 months PN, − 73%, p < 0.001; 9 months PN vs 3 months PN, − 90%, bp < 0.001; 9 months PN vs 6 months PN, − 18%, p < 0.01) PHENOTYPE:
|
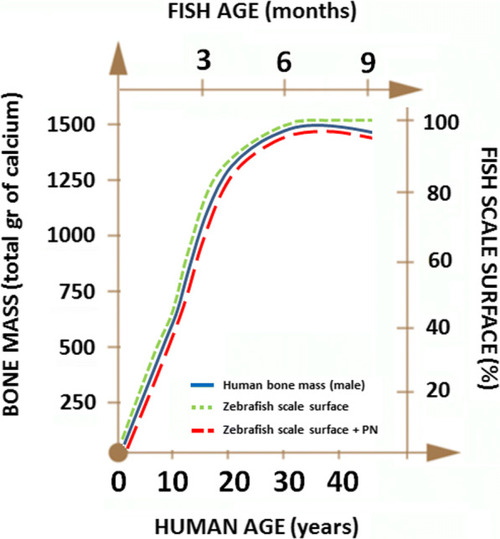
Comparison between bone growth (human male) and scale growth (zebrafish male) at different age. In zebrafish, the catabolic phase is accelerated by prednisolone (PN) |