FIGURE SUMMARY
Title

Early leucine programming on protein utilization and mTOR signaling by DNA methylation in zebrafish (Danio rerio)

Authors
Zhu, Q.S., Wang, J., He, S., Liang, X.F., Xie, S., Xiao, Q.Q.
Source
Full text @ Nutr. Metab. (Lond).

The leucine level in whole-body of zebrafish after early leucine programming at 13 dph. The value represented mean ± S. E.M. (n = 6), marked with an asterisk means significant level (P < 0.05)

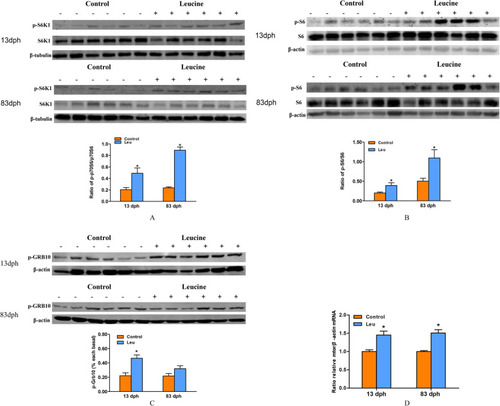
The phosphorylation status of mTOR downstream factors (S6K1, S6, Grb10) and the mRNA expression of mtor gene were displayed. Western blot analysis of phosphorylation status of mTOR downstream factors S6K1 (a), S6 (b) and Grb10 (c), meanwhile, the mRNA expression of mtor gene was analyzed by real-time qPCR (d). Each value is the mean ± S. E.M. (n = 6). Values marked with an asterisk means significant level (P < 0.05)

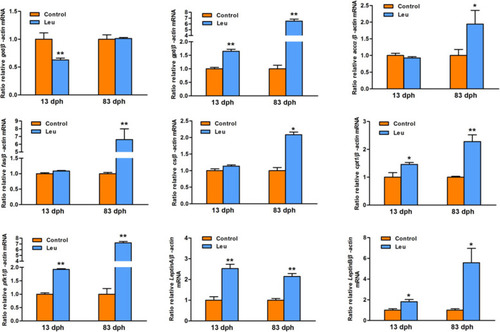
The mRNA expression of genes related to metabolism. The value represented mean ± S. E.M. (n = 6), marked with an asterisk means significant level (P < 0.05), marked with two asterisk means extremely significant level (P < 0.01)

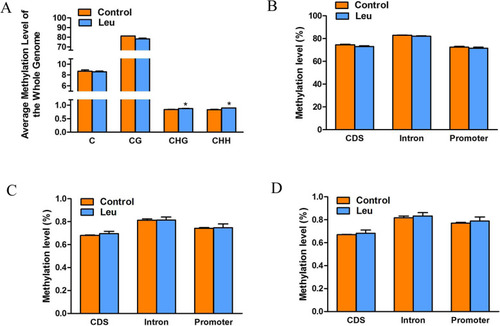
The average genome-wide methylation levels (a) and DNA methylation levels of different genomic regions (b-d). The value represented the mean ± S. E.M. (n = 3), marked with an asterisk means significant level (P < 0.05). A: X-axis represented methylation types, Y-axis represented average genome-wide methylation levels. B: X-axis represented genomics features, Y-axis represented methylation levels. b CG regions, c CHG regions, (d) CHH regions

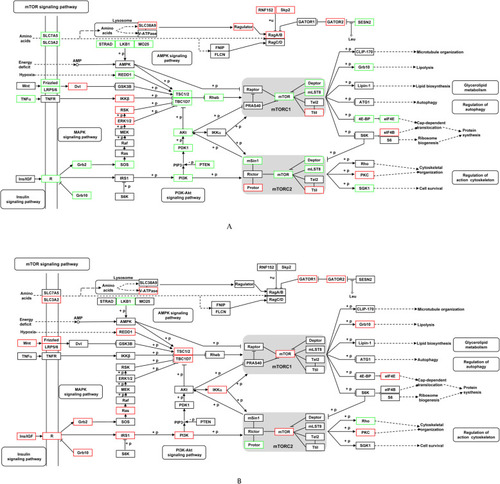
Differentially methylated genes of mTOR signaling pathway at CG (a) and CHH types (b). Compared with the control group, the red marked that the methylation levels of the genes were higher in zebrafish of the leucine programming group, and the green marked the lower levels

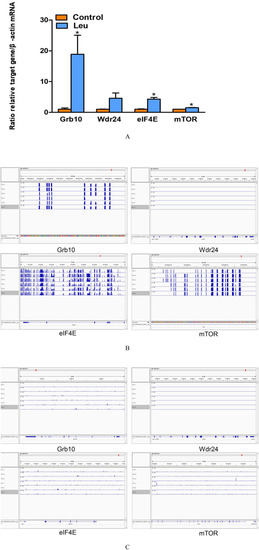
The mRNA expression (a), the methylation status in CG (b) and CHH (c) type of DMGs involved in mTOR signaling pathway. All qRT-PCR reactions were performed with six biological replicates, the value represented the mean ± S. E.M. marked with an asterisk means significant level (P < 0.05). Displayed DNA methylation status of Grb10, eIF4E, mTOR and Wdr24 by IGV tool. Con-1, Con-2, Con-3: samples of the control group; Leu-1, Leu-2, Leu-3: samples of the leucine programming group

Acknowledgments
This image is the copyrighted work of the attributed author or publisher, and ZFIN has permission only to display this image to its users. Additional permissions should be obtained from the applicable author or publisher of the image. Full text @ Nutr. Metab. (Lond).