FIGURE SUMMARY
Title

Chemical composition and anti-oxidant potential on essential oils of Thymus quinquecostatus Celak. from Loess Plateau in China, regulating Nrf2/Keap1 signaling pathway in zebrafish

Authors
He, T., Li, X., Wang, X., Xu, X., Yan, X., Li, X., Sun, S., Dong, Y., Ren, X., Liu, X., Wang, Y., Sui, H., Xia, Q., She, G.
Source
Full text @ Sci. Rep.

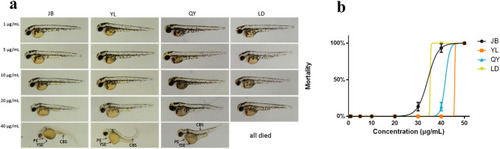
The toxicity of thyme oils in zebrafish larvae (a). Mortality curves until 48 hpf (b). Results are presented as means ± SD (n = 15). YSE: yolk sac edema; PE: pericardial edema; CBS: curved body shape.

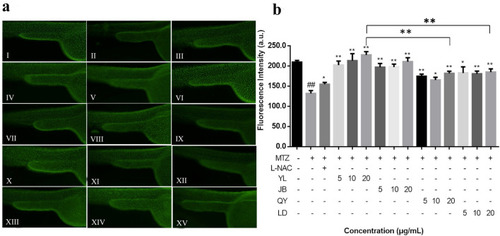
Thyme oils inhibited MTZ-induced oxidative insults in skin cells of Tg (krt4: NTR-hKikGR)cy17 transgenic zebrafish (a): Control group (I); MTZ-treatment group (II); MTZ + L-NAC-treatment gruop (III); MTZ + YL-thyme oil-treatment group at the concentration of 5 μg/mL (IV), 10 μg/mL (V) and 20 μg/mL (VI); MTZ + JB-thyme oil-treatment group at the concentration of 5 μg/mL (VII), 10 μg/mL (VIII) and 20 μg/mL (IX); MTZ + QY-thyme oil-treatment group at the concentration of 5 μg/mL (X), 10 μg/mL (XI) and 20 μg/mL (XII); MTZ + LD-thyme oil-treatment group at the concentration of 5 μg/mL (XIII), 10 μg/mL (XIV) and 20 μg/mL (XV); Determination of fluorescence intensity by Image analysis (b); The values are expressed as mean ± SD (n = 15). * Represents p-value less than 0.05 and ** represents p-value less than 0.01 vs. MTZ group; # represents p value less than 0.05 and ## represents p value less than 0.01 vs. control group.

Determination of ROS levels in zebrafish larvae from 48 hpf in Control group, AAPH-treatment group, AAPH + L-NAC-treatment group (a); Determination of ROS levels in zebrafish larvae from 48 hpf after treatment with YL-thyme oil, JB-thyme oil, QY-thyme oil and LD-thyme oil (b); Determination of mean DCF fluorescence intensity by Image analysis (c). The values are expressed as mean ± SD (n = 15). * Represents p-value less than 0.05 and ** represents p value less than 0.01 vs. AAPH-induced group; # represents p-value less than 0.05 and ## represents p-value less than 0.01 vs. control group.

Acknowledgments
This image is the copyrighted work of the attributed author or publisher, and ZFIN has permission only to display this image to its users. Additional permissions should be obtained from the applicable author or publisher of the image. Full text @ Sci. Rep.