FIGURE SUMMARY
Title

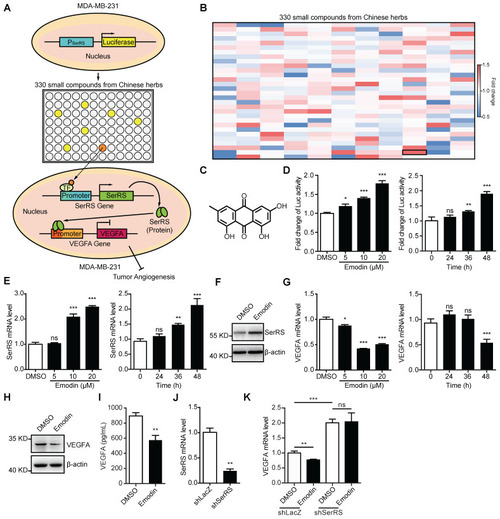
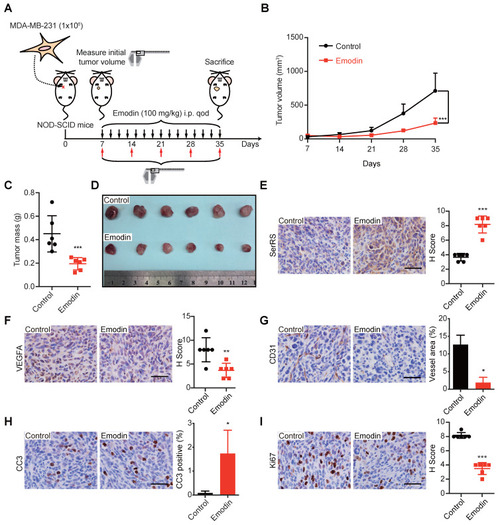
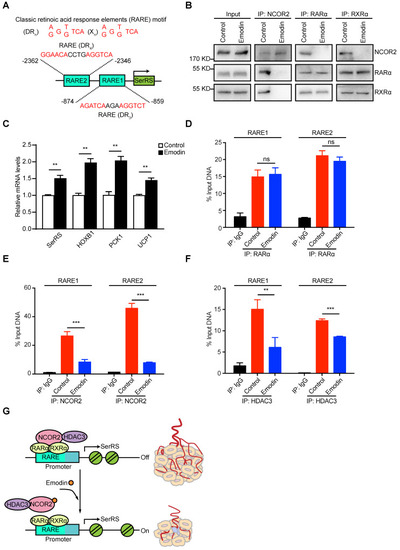
Herb-sourced emodin inhibits angiogenesis of breast cancer by targeting VEGFA transcription

Authors
Zou, G., Zhang, X., Wang, L., Li, X., Xie, T., Zhao, J., Yan, J., Wang, L., Ye, H., Jiao, S., Xiang, R., Shi, Y.
Source
Full text @ Theranostics

Emodin increases SerRS expression and suppresses VEGFA expression in MDA-MB-231 cells. (A) Diagram illustrating system for screening in house library of compounds from Chinese herbs for increased SerRS expression (TF, transcriptional factor). (B) Heatmap of 330 compounds that regulate SerRS expression based on firefly/renilla ratio. Compared with DMSO, compounds with >1.0-fold change were regarded as effective compounds. (C) Chemical structure of emodin. (D) Effect of concentration of emodin and duration of treatment on firefly/renilla ratio. (E) mRNA level of SerRS from MDA-MB-231 cells; effect of concentration and treatment time with emodin. (F) Protein level of SerRS from MDA-MB-231 cells treated with emodin (10 µM) for 48 h. (G) mRNA level of VEGFA from MDA-MB-231 cells; effect of concentration and treatment time with emodin. (H) Protein level of VEGFA from MDA-MB-231 cells treated with emodin for 48 h. (I) ELISA detection of VEGFA expression in MDA-MB-231 cells treated with emodin for 48 h. (J) mRNA level of SerRS in MDA-MB-231 cells following lentiviral infection of shRNA targeting human SerRS. (K) mRNA levels of VEGFA from MDA-MB-231-shLacZ and MDA-MB-231-shSerRS cells treated with emodin for 48 h. n=3 for D-K; data are means ± SD., *p<0.05; **p<0.01; ***p<0.001; ns, no significant difference; by one-way ANOVA for D, E, G; by Student's t-test for I-K.

Emodin inhibits angiogenesis in zebrafish embryos and Matrigel plugs. (A) Representative Tg (Fli1a: GFP) zebrafish embryos showing normal and hypo (arrowheads) ISV phenotypes at 3 days post fertilization +/- emodin are shown (left); percentage of embryos with each ISV phenotype (right) (Scale bar, 0.2 mm). (B) mRNA levels of SerRS and VEGFA from Tg (Fli1a: GFP) zebrafish treated with emodin relative to controls (n=3). (C) mRNA levels of SerRS and VEGFA from MDA-MB-231 cells; effect of concentration with emodin. (D) Western blot of SerRS expression in 4T1 cells treated with emodin (10 µM) for 48 h (n=3). (E) Flowchart of Matrigel plug assay. (F) Representative images of Matrigel plugs following vehicle or emodin treatment (n=6). Scale bar, 1 cm. (G) CD31 staining (red) in control and emodin-treated Matrigel plugs. (H) Percent vessel area in Matrigel plugs. Scale bar, 100 µm. (I) SerRS staining of Matrigel plugs. (J) Quantification of SerRS-positive cells (n=6). (K) VEGFA staining in control and emodin-treated Matrigel plugs. (L) Quantification of VEGFA-positive cells (n=6). Scale bar, 100 µm. Scale bar, 100 µm. Data are means ± SD., *p<0.05, ** p<0.01 ***p<0.001; by Chi-square for A; by one-way ANOVA for C; by Student's t-test for B, H, J, L.

Emodin exhibits antitumor and anti-angiogenesis activity in a xenograft model. (A) Flow diagram of MDA-MB-231 cells implanted orthotopically into the 2nd mammary fat pad of female NOD-SCID mice and treated intraperitoneally with DMSO or emodin every other day until sacrifice (n=6). (B) Tumor growth curve for control and emodin-treated mice. (C) Weight of tumors at sacrifice of the mice. (D) Representative images of primary tumors. (E) Staining for SerRS-positive cells in control and emodin-treated mouse tumors and quantification (n=6). (F) Staining for VEGFA-positive cells in tumors and quantification (n=6). (G) CD31 staining of tumors and quantification of vessel area (n=6). (H) Staining for Cleaved Caspase 3 (CC3)-positive cells in tumors and quantification (n=6). (I) Staining for Ki67-positive cells in tumors and quantification (n=6). Scale bars, 100 µm. Data are means ± SD., *p<0.05, **p < 0.01, ***p < 0.001 by Student's t-test.

Emodin inhibits angiogenesis and distant metastasis in an immunocompetent allograft model. (A) Experimental scheme of 4T1-luciferase cells implanted orthotopically into the 4th mammary fat pad of female BALB/c mice and treated intraperitoneally with DMSO or emodin every other day until sacrifice (n=4). (B) Tumor growth curve for control and emodin-treated mice. (C) Tumor mass at sacrifice. (D) Bioluminescence in major organs indicating the presence of tumors from metastases from the primary tumor and percent incidence in each organ. (E) Overall survival rate of mice in different treatment groups (n=8). (F-J) Immunostaining of cells and quantification in control and emodin-treated mice for SerRS (F); VEGFA (G); CD31 (H); CC3 (I); and, Ki67 (J). n=4; data are means ± SD., * p<0.05, ** p<0.01, *** p<0.001; by one-way ANOVA for B and C; by Log-rank test for E; by Student's t-test for F-J. Scale bar, 100 µm.

Emodin can directly bind to NCOR2. (A) Effect of concentration of emodin and emodin-biotin (B-Emodin) on transcription of SerRS expressed as firefly/renilla ratio (n=3). (B) The protein level of SerRS with emodin (10 µM) and B-Emodin (10 µM). (C) SDS-PAGE of MDA-MB-231 cell lysates incubated with free biotin or B-Emodin following protein affinity pull-down and coomassie blue staining (n=3). Arrows indicate bands analyzed by mass spectrometry (MS). (D) Immunoblot with anti-NCOR2, anti-ACACA, anti-FASN, anti-CAD, and anti-α-Tubulin antibodies of protein precipitated by streptavidin beads from MDA-MB-231 cell lysates in the presence of B-Emodin or biotin (10 µM). (E) shRNA target human NCOR2 was transfected into MDA-MB-231 cells, NCOR2 expression in MDA-MB-231 cells was determined by qPCR after shRNA transfection. (F) mRNA levels of SerRS from MDA-MB-231-shLacZ and MDA-MB-231-shNCOR2 cells treated with emodin for 48 h (n=3). (G) Representations of the predicted binding modes of emodin with NCOR2, SANT2. (H) Immunoblot with anti-NCOR2 antibody of purified proteins (GST and GST-NCOR2 SANT2) incubated with B-Emodin (10 µM) or biotin and precipitated by streptavidin beads. Data are means ± SD., ns, no significant difference; **p<0.01; ***p<0.001; by one-way ANOVA for A; by Student's t-test for E, F.

Emodin can dissociate NCOR2 from the promoter of SerRS. (A) Two classic retinoic acid response elements (RARE) motifs located on the promoter of SerRS (DR, direct repeats; X, any nucleotide; n, number of interspacing nucleotides). (B) Co-immunoprecipitation with anti-NCOR2, anti-RARα and anti-RXRα antibodies of cell lysates after 48 h treatment of MDA-MB-231 cells with DMSO or emodin (10 µM). (C) mRNA levels of SerRS, HOXB1, PCK1, and UCP1 from MDA-MB-231 cells treated with emodin (10 µM) relative to controls (n=3). (D-F) Chromatin Immunoprecipitation assays of MDA-MB-231 cells with, anti-RARα, anti-NCOR2 and anti-HDAC3 antibodies followed by qPCR with specific primers for the SerRS promoter (n=3; **p<0.01, ***p<0.001, ns, no significant difference; by Student's t-test). (G) Model for angiogenesis inhibition by emodin through direct targeting of NCOR2 and subsequent inactivation of the SerRS/VEGFA axis.

Acknowledgments
This image is the copyrighted work of the attributed author or publisher, and ZFIN has permission only to display this image to its users. Additional permissions should be obtained from the applicable author or publisher of the image. Full text @ Theranostics