
- Title
-
Zebrafish macrophage developmental arrest underlies depletion of microglia and reveals Csf1r-independent metaphocytes
- Authors
- Kuil, L.E., Oosterhof, N., Ferrero, G., Mikulášová, T., Hason, M., Dekker, J., Rovira, M., van der Linde, H.C., van Strien, P.M., de Pater, E., Schaaf, G., Bindels, E.M., Wittamer, V., van Ham, T.J.
- Source
- Full text @ Elife
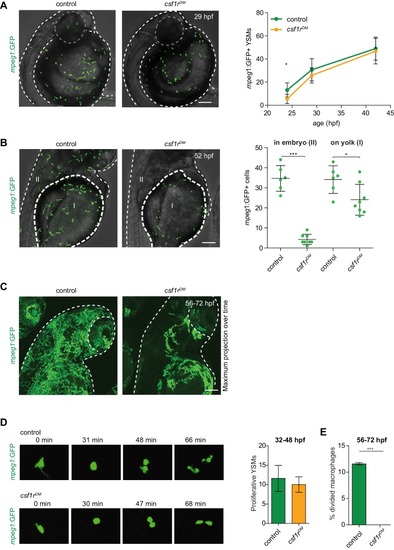
mpeg1+ primitive macrophages on the yolk in control and csf1rDM larvae.(A) Representative images of mpeg1+ macrophages located on the yolk (29 hpf) and quantification of mpeg1+ cell numbers over time. (B) Representative images of mpeg1+ positive primitive macrophages at 52 hpf. The dotted line indicates the border between the yolk (I) and the embryonic tissue (II). Quantification of mpeg1+ macrophages that colonized the tissue (II) and primitive macrophages located on the yolk (I). (C) Representative maximum projection of long term time lapse imaging of control and csf1rDM larvae showing migratory trajectories of mpeg1+ macrophages. (D) Snap shots from dividing mpeg1+ primitive macrophages in control and csf1rDM larvae (~36 hpf) and quantification of proliferative primitive macrophages during 16 hr time lapse imaging (~32 hpf – 48 hpf) (control n = 5, csf1rDM n = 3). (E) Quantification of fraction proliferative embryonic macrophages during 16 hr time lapse imaging (~56 hpf – 72 hpf) in control and csf1rDM larvae (n = 3 per group). Scale bars represent 100 µM. Error bars represent standard deviation. Statistical significance is calculated using one-way ANOVA with Dunnett’s multiple comparison test or Student’s t-tests *<0.05 **<0.01 ***<0.001. mpeg1+ cells were quantified on one side of the embryo (right side). Each dot represents one fish. |
( |
( |
( |
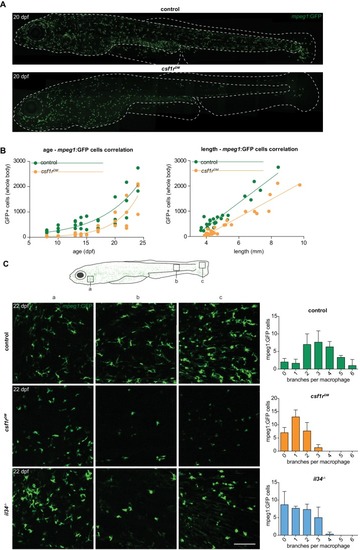
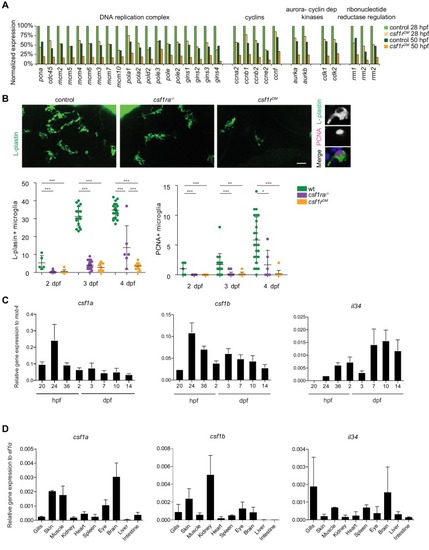
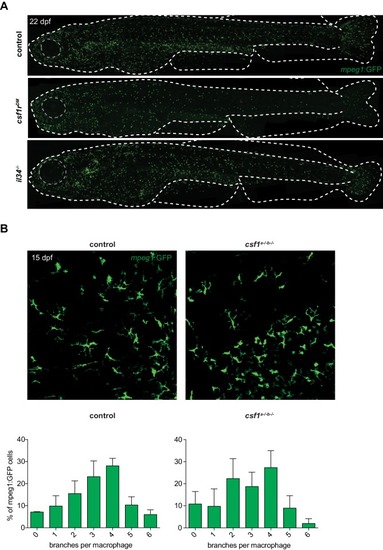
Two morphologically distinct populations of mpeg1+ cells in emerge from 15 dpf in the zebrafish skin.(A) Representative images of a control and csf1rDM zebrafish at 20 dpf. Dotted line represents the outline of the fish and its eye. (B) Quantification of the total number of mpeg1+ cells at one unilateral side of the fish at different time points between 8 and 24 dpf. The number of mpeg1+ cells was manually counted from the unilateral side presented in panel A. Plot showing the relationship between number of mpeg1+ cells and fish size. Each dot represents one fish. (C) Representative images of mpeg1+ cells in different body regions at 22 dpf showing differences in morphology between controls and csf1rDM or il34-/-mpeg1+ cells (n = 3 per group). Error bars represent standard deviation. Mpeg1+ cells were quantified on one side of the embryo (right side). |
( |
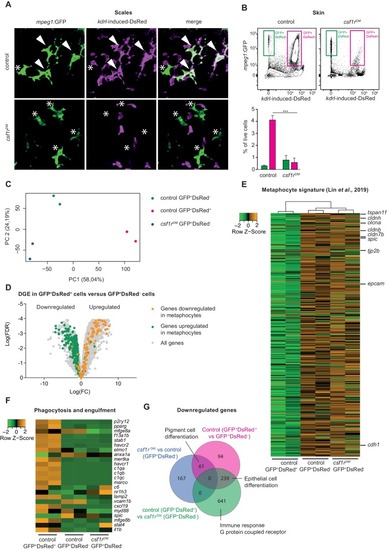
Amoeboid mpeg1+ cells in the zebrafish skin are of non-hematopoietic origin and have a metaphocyte transcriptome.(A) Immunofluorescence on manually dissected scales from adult skin of control and csf1rDMmpeg1:EGFP +; kdrl-induced-DsRed+ adults (4 mpf). Stars: single-positive (SP) cells; white arrowheads: double-positive (DP) cells. (B) FACS analysis on cells from the adult skin (4 mpf, n = 3 per group) and quantification. GFP+DsRed-=mpeg1+ only, GFP+DsRed+=mpeg1+/kdrl-induced-DsRed+. (C) PCA analysis showing segregatin based on cell type (PC1) and genotype (PC2). (D) Volcano plot showing gene expression changes between control GFP+DsRed+ versus GFP+DsRed- cells. Light grey: DGE of all genes, Green: DGE of genes enriched in metaphocytes logFC >2 (Lin et al., 2019); Orange: DGE of genes downregulated in metaphocytes logFC <2 (Lin et al., 2019). (E) Heat map showing the expression of metaphocyte signature genes. (F) Heat map showing the expression of phagocytosis and engulfment genes. (G) Venn diagram showing DGE between the three groups (logFC > |2|; FDR < 0.05). |