
- Title
-
Single-cell in vivo imaging of cellular circadian oscillators in zebrafish
- Authors
- Wang, H., Yang, Z., Li, X., Huang, D., Yu, S., He, J., Li, Y., Yan, J.
- Source
- Full text @ PLoS Biol.

(a) The upper graph shows the schematic of |

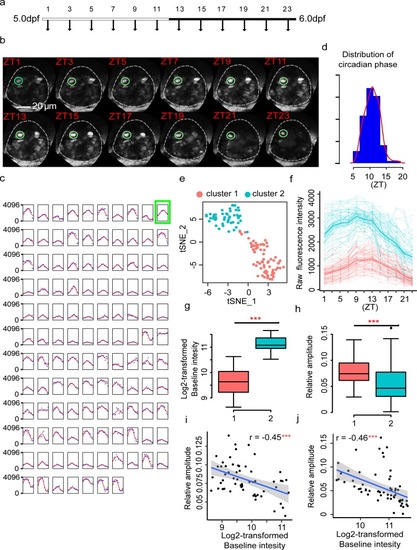
(a) t-SNE visualization of brain cell clusters. The clusters were annotated by comparing to the adult zebrafish scRNA-seq data. (b) Violin plot demonstrated the clusters with enriched expression of |
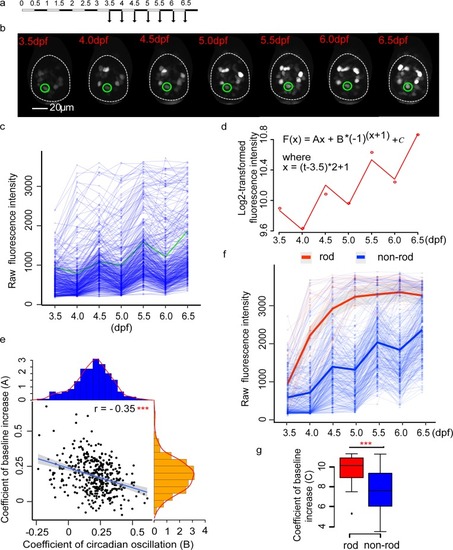
(a) Experimental design to examine the developmental dynamics of |
(a) Experimental design to examine the developmental dynamics of |

(a) Experimental design to investigate the effect of light on the onset of circadian clock development. (b) Expression patterns of all cells under DD condition during development (four fish). Each thin line represents one cell. Each thick line represents the loess-smoothed curve of all cells in each individual fish. The shaded area shows the 95% confidence level of the smoothed curve. (c) Comparison of oscillating coefficient (B) between LD (six fish) and DD (four fish) cells. Two-tailed Student |