FIGURE SUMMARY
Title

Trajectory data of antero- and retrograde movement of mitochondria in living zebrafish larvae

Authors
Mieskes, F., Wehnekamp, F., Pluci?ska, G., Thong, R., Misgeld, T., Lamb, D.C.
Source
Full text @ Data Brief

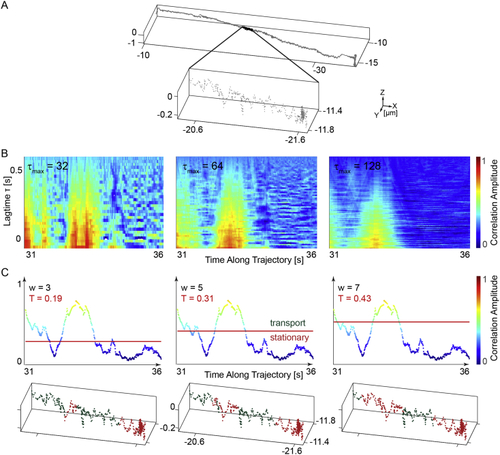
Correlation analysis of a mitochondrial retrograde trajectory. (a) An example trajectory and zoom in of a moving mitochondrion in the retrograde direction with a time resolution of 100 Hz. (b) Correlation carpets of the lateral angles Φ(t) between consecutive orbits with different sliding windows τmax. (c) The correlation amplitude determined from the sum of the correlation function over a sliding window of 64 data points is plotted. Three different weighting factors corresponding to thresholds of 3, 5, and 7 times the standard deviation of the correlation function calculated from the randomized trace (Equation (2)) are shown in red. The lower plots show the influence of the different thresholds on the separation of regions of directed transport (shown in green) and stationary phases (shown in red) for the zoomed in region of the trace in panel (a).

Acknowledgments
This image is the copyrighted work of the attributed author or publisher, and ZFIN has permission only to display this image to its users. Additional permissions should be obtained from the applicable author or publisher of the image. Full text @ Data Brief