
- Title
-
Nutritional programming improves dietary plant protein utilization in zebrafish Danio rerio
- Authors
- Kwasek, K., Wojno, M., Iannini, F., McCracken, V.J., Molinari, G.S., Terova, G.
- Source
- Full text @ PLoS One
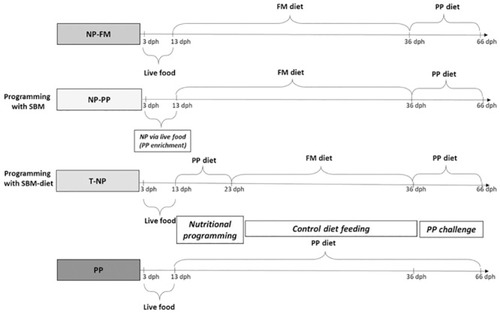
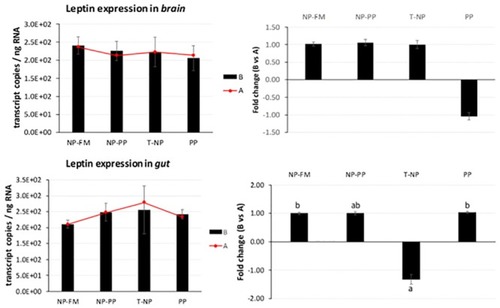
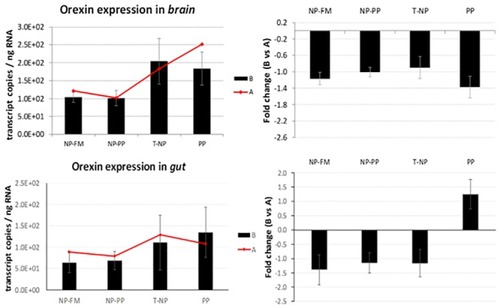
NP–nutritional programming, FM–fishmeal, PP–plant protein, SBM–soybean meal. |
|
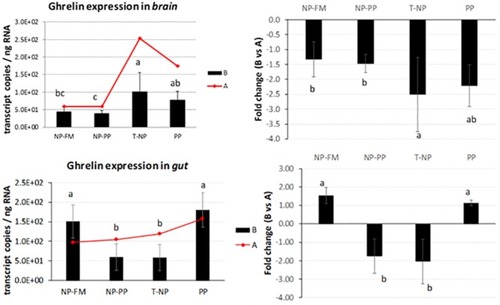
The expression of |
The expression of |
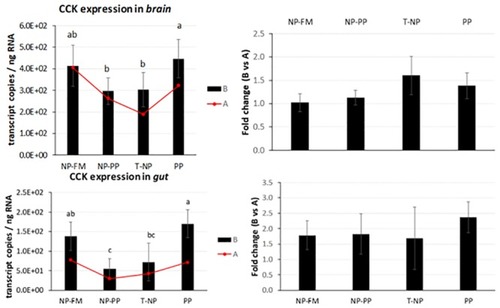
The expression of |
The expression of |
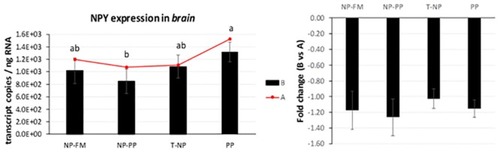
The expression of |