FIGURE SUMMARY
Title

New role of the antidepressant imipramine as a Fascin1 inhibitor in colorectal cancer cells

Authors
Alburquerque-González, B., Bernabé-García, M., Montoro-García, S., Bernabé-García, Á., Rodrigues, P.C., Ruiz Sanz, J., López-Calderón, F.F., Luque, I., Nicolas, F.J., Cayuela, M.L., Salo, T., Pérez-Sánchez, H., Conesa-Zamora, P.
Source
Full text @ Exp. Mol. Med.

Results obtained after ligand-based pharmacophore screening with LigandScout.

a 2D diagram of matching hydrophobic pharmacophoric features between (yellow spheres) migrastatin and imipramine. b 3D alignment of migrastatin (blue skeleton) and imipramine (yellow skeleton).

In vitro validation of imipramine binding to fascin1.

a Differential scanning fluorimetry assays. The right panel shows the first derivative of the thermal denaturation profiles of fascin1 in the absence (black) and in the presence of 1 mM imipramine (red in triplicate). The left panel summarizes the changes in Tm induced by the presence of the selected compounds at 1 mM in 10% DMSO. b Fluorescence titration. The right panel shows the fluorescence emission spectra of fascin1 in the presence of increasing concentrations of imipramine. The left panel shows the binding isotherm. White circles represent the center of mass of the different spectra, and the continuous lines symbolize the best fit of the data to a one-site binding model.

F-actin bundling activity assay.

a Assay of actin-bundling activity with a low-speed cosedimentation assay. Polymerized F-actin (10 µM) was incubated with fascin1 (1 µM) in the presence (+) or absence (−) of imipramine and DMSO (control). b Quantification of the F-actin bundling assay from (a). The results are the means and SD (n = 4, *p < 0.01).

TEM visualization of actin binding and bundling activities in the presence of fascin1 and inhibitors (negative staining).

a Stained polymerized F-actin filaments alone. b Under control conditions (DMSO), actin filaments were incorporated into bundles in the presence of untreated fascin1 at a 1:1 ratio. c Binding and bundling assays with filamentous F-actin and fascin1 previously incubated with 100 μM migrastatin. d Binding and bundling assays with filamentous F-actin and fascin1 previously incubated with 10 μM imipramine. High-magnification images (×93,000) show examples of aberrant morphology in the treated fascin1 conditions (c, d). e Quantitative analysis of the numbers of actin filaments in the presence of the compounds and comparison to control conditions (***p < 0.001).

Cell morphology of HCT-116 and HaCat cells upon inhibition of lamellipodia and filopodia formation.

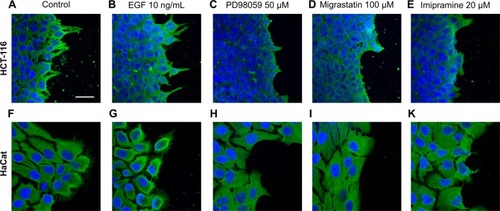
Inset shows the immunofluorescence analysis of the fascin1 marker (green) under control conditions: af control conditions, bg 10 ng/mL EGF (migration stimulator), ch 50 µM PD98059 (MEK inhibitor), di 100 µM migrastatin, and ek 20 µM imipramine. Images were captured using an LSM 510 META confocal fluorescence microscope with a ×63 oil objective. Scale bar 30 µm. Migrastatin and imipramine inhibit lamellipodia protrusion and fascin1 localization in a similar way to the migration MEK inhibitor PD98059 in both cell lines.

Myoma organotypic invasion model showing.

a The effect of 100 µM migrastatin and imipramine (10 and 20 µM) on the HCT-116 colorectal cell line. Quantifiable effect on the invasion area (b) and on the invasion depth (c). **p < 0.001, ***p < 0.0001.

Zebrafish invasion assays 4 days post xenograft.

a The images show the invasive and noninvasive cells in a zebrafish invasion model. The invasiveness of each cell line in this model is shown in the right panel. b HCT-116 cancer cells were treated with migrastatin and imipramine and then injected into zebrafish larvae. The effect of imipramine in diminishing the cell invasion percentage and the number of invasive cells is similar to that of migrastatin. c Fascin1 mRNA levels in transfected DLD-1 cells and cell invasion associated with transfection (lower panel). d Effect of drugs on the average percentage of zebrafish larvae invasion in fascin1-transfected DLD-1 cells. Data are shown as the mean ± SD, compared with the control, *p = 0.049–0.01; **p = 0.001–0.009; ***p = 0.0001–0.0009; ****p < 0.0001.

Antimetastatic potential of imipramine in zebrafish.

a At day 6 post injection, larvae were examined to evaluate whether micrometastasis developed by invading native HCT-116 cells. b The evaluation criteria were the presence of human cancer cell colonies (arrows) outside the yolk sac. Invading single cells are indicated by asterisks (*). Data are shown as the mean ± SD, compared with the control, *p = 0.049–0.01; **p = 0.001–0.009.

Acknowledgments
This image is the copyrighted work of the attributed author or publisher, and ZFIN has permission only to display this image to its users. Additional permissions should be obtained from the applicable author or publisher of the image. Full text @ Exp. Mol. Med.