
- Title
-
Protective Effect and Mechanisms of New Gelatin on Chemotherapy-Induced Hematopoietic Injury Zebrafish Model
- Authors
- Han, L., Kong, H., Liu, F., Li, X., Zhang, S., Zhang, X., Wu, Y., Yang, H., Zhang, A., Liu, K.
- Source
- Full text @ Evid. Based Complement. Alternat. Med.

Effect of NG on the number of thrombocytes in zebrafish induced by vinorelbine (NVB). The number of CD41-GFP+ cells was counted in the caudal hematopoietic tissue area of zebrafish. (a) Phenotypes of larvae of Tg (CD41 : EGFP) lines. (b) Number of CD41-GFP+ cells at 72 hpf. The values are expressed as mean ± SEM ( |
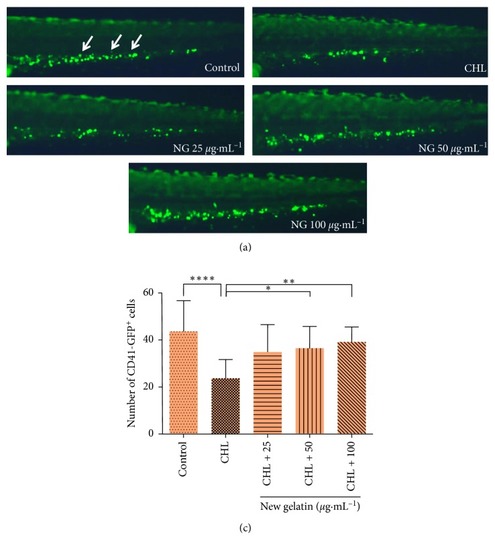
Effect of NG on the number of thrombocytes in zebrafish induced by chloramphenicol (CHL). The number of CD41-GFP+ cells was counted in the caudal hematopoietic tissue area of zebrafish. (a) Phenotypes of larvae of Tg (CD41 : EGFP) lines. (b) Number of CD41-GFP+ cells at 72 hpf. The values are expressed as mean ± SEM ( |

Effect of NG on the number of erythrocytes in zebrafish induced by methotrexate (MTX). (a) Phenotypes of larvae of wild-type AB lines. (b) The staining intensity of erythrocytes at 48 hpf. The values are expressed as mean ± SEM ( |
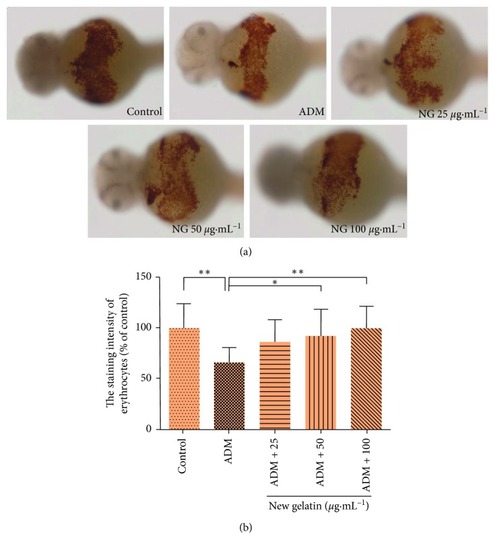
Effect of NG on the number of erythrocytes in zebrafish induced by doxorubicin (ADM). (a) Phenotypes of larvae of wild-type AB lines. (b) The staining intensity of erythrocytes at 48 hpf. The values are expressed as mean ± SEM ( |

Effect of NG on the number of erythrocytes in zebrafish induced by mechlorethamine hydrochloride (MH). (a) Phenotypes of larvae of wild-type AB lines. (b) The staining intensity of erythrocytes at 48 hpf. The values are expressed as mean ± SEM ( |

Expression of related genes in zebrafish hematopoietic injury model pretreated by methotrexate (MTX). The mRNA levels of |