FIGURE SUMMARY
Title

Proteomics analysis of extracellular matrix remodeling during zebrafish heart regeneration

Authors
Garcia-Puig, A., Mosquera, J.L., Jiménez-Delgado, S., García-Pastor, C., Jorba, I., Navajas, D., Canals, F., Raya, A.
Source
Full text @ Mol. Cell. Proteomics

Decelularization protocol for zebrafish hearts.A, Representation of the protocol used to decellularize zebrafish ventricles. B, Images of the ventricles at different points of the decellularization protocol. From left to right, native ventricle, after 0.5% SDS, and at the end of the decellularization ptotocol (scale bar 500 μm). C–E, The efficiency of the decellularization process was characterized by DAPI staining (scale bar 50 μm) (C), spectrophotometric quantification of DNA (n = 3) (D), and Masson's trichrome (E, upper images) and Hematoxylin and Eosin (E, lower images) staining (scale bar 100 μm). F, Box plot representing an overall distribution of the average intensities of each protein in each sample group. ECM proteins and intracellular proteins have been independently plotted to better visualize the effect of decellularization in each class of proteins. G, The profile of specific ECM, cytoplasmic and nuclear proteins is plotted, showing loss of intracellular proteins and enrichment of ECM proteins during the decellularization protocol. Statistical significance of DNA content was analyzed with unpaired Student's t test. *, p < 0.05.

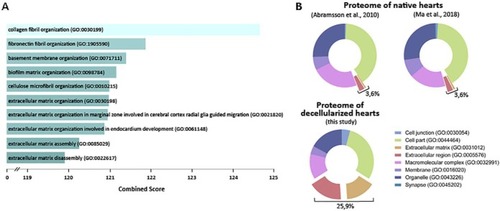
Decellularized zebrafish ventricles are enriched in ECM proteins.A, Representation of the 10 most enriched Biological Process GO terms in our proteome of control hearts. Combined score is taken from Enrich program, which takes the log of the p value from the Fisher exact test and multiplies it by the z-score of the deviation from the expected rank. B, Representation of the Cell Component Gene Ontology (GO) of the published zebrafish heart proteome of Abramsson et al. (2010) (55), the published sham heart proteome of Ma et al. (2018) (59) and our proteomic analysis of decellularized zebrafish ventricles. Panther assigned GO terms to 138, 1902, and 60 proteins from the proteomes described in Abramsson et al. (2010) (55), Ma et al. (2018) (59), and the one described here, respectively.

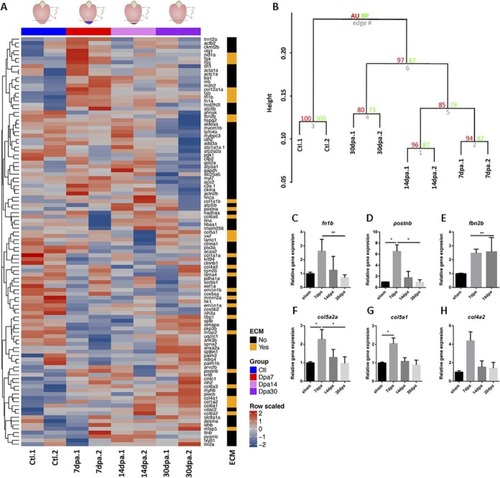
Changes in ECM protein composition during heart regeneration.A, Heat-map for the 96 proteins detected across samples in zebrafish control decellularized hearts (Ctl) and at different time points of regeneration. The time points analyzed were 7 dpa, 14 dpa, and 30 dpa. Red indicates increased protein expression and blue indicates reduced protein expression. The ECM column indicates the ECM proteins in orange. Data are row scaled. B, Hierarchical clustering with bootstrap analysis of all the samples. AU, Approximately Unbiased p value; BP, Bootstrap Probability value. C–H, Gene expression assessment by real time qPCR of the ECM proteins significantly changing in the proteomic analysis during the regeneration process. fn1b, fibronectin 1b; postnb, periostin b; col5a1, collagen type 5 α1 chain; col4a2, collagen type 4 α2 chain; col5a2a, collagen type 5 α2a chain; fbn2b, fibrillin 2b. Significance was analyzed with Kruskal-Wallis followed by a Dunn's multiple comparisons test. *, p < 0.05; **, p < 0.01.

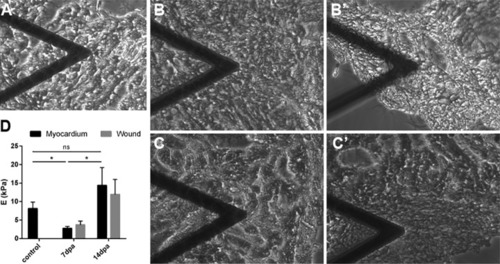
Stiffness of the extracellular matrix of regenerating hearts.A–C, Bright field images of decellularized zebrafish hearts being analyzed by AFM at the myocardium away from the injury area. B'–C', Bright field images of decellularized zebrafish hearts being analyzed by AFM at the regenerating area. A, Control decellularized heart, B, B', 7 dpa decellularized hearts, C, C', 14 dpa decellularized heart. The triangular shape in A–C and B'–C' is the AFM cantilever. E, Young's modulus of the heart ECM of noninjured, 7 dpa, and 14 dpa hearts (n = 5 each). dpa, Days postamputation. Statistically significance was assessed with Man-Whitney test. *, p < 0.05.

Acknowledgments
This image is the copyrighted work of the attributed author or publisher, and ZFIN has permission only to display this image to its users. Additional permissions should be obtained from the applicable author or publisher of the image. Full text @ Mol. Cell. Proteomics