
- Title
-
Functional Urate-Associated Genetic Variants Influence Expression of lincRNAs LINC01229 and MAFTRR
- Authors
- Leask, M., Dowdle, A., Salvesen, H., Topless, R., Fadason, T., Wei, W., Schierding, W., Marsman, J., O'Sullivan, J.M., Merriman, T.R., Horsfield, J.A.
- Source
- Full text @ Front Genet
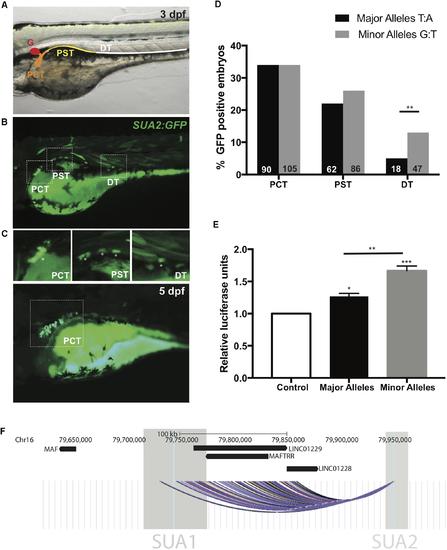
SUA2 is a functional enhancer that physically connects to the lincRNA region. An enhancer construct containing the SNP region (e.g., major alleles) injected at the one-cell stage in developing zebrafish embryos drives transient GFP reporter expression in the proximal tubules of 24 hpf, 48 hpf, and 3 dpf embryos. (A) 48 hpf embryo with schematic depicting the zebrafish pronephros: glomerulus (G, red); proximal convoluted tubule (PCT, orange); proximal straight tubule (PST, yellow); distal tubule (DT, green). (B) Representative image from a 3 dpf embryo with mosaic GFP expression in the PCT, PST and DT. Insets of the PCT, PST and DT are below. Asterisks indicate GFP positive cells. (C) Representative image from a 5 dpf embryo with mosaic GFP expression found exclusively in the PCT. (D) Percentage of transgene positive embryos that present with GFP-positive cells in the PCT, PST, and DT in enhancer constructs containing the SNP region with either the major or minor alleles for SNPs rs4077450and rs4077451 at 3 dpf. The total number of embryos that were transgene-positive for the major allele fragment was 349. The total number of embryos that were transgene-positive for the minor allele fragment was 413. Numbers in each group are represented at the bottom of each bar in the graph. (E) Luciferase reporter assay in HEK293 cells with an empty pGL4.23 vector (control), or a pGL4.23 vector containing the SNP region with either the major (urate-lowering) or minor (urate-raising) alleles of the SNP. Luciferase expression is plotted relative to the expression of Renilla and normalized to the expression from the empty vector. A one-way ANOVA test resulted in a significant difference between the means of the control and the SNP region containing both the minor and major allele and a significant difference between the means of the major and minor alleles. Asterisks indicate the set of values that were significantly different from the control; ∗p < 0.05, ∗∗p < 0.005 and ∗∗∗p < 0.0005. (F) The intergenic region upstream of MAF that encompasses the lincRNAs MAFTRR, LINC01229 and LINC01228. Also shown are the locations of SUA1 and SUA2. The region of interaction for the interaction fragment that encompasses the rs4077450_rs4077451 SNP region is indicated, data are from Rao et al. (2014) using K562 (black), NHEK (blue), IMR90 (yellow), HMEC (red), GM12878 (purple) and KBM7 (gray) cells. The interaction region is the combination of 45 interactions with the rs4077450_rs4077451SNP region. |

Zebrafish maf coincides with SUA2 enhancer activity. (A–C) Whole mount in situ hybridization with a riboprobe detecting zebrafish maf was performed on wild type embryos at 12, 24, and 48 hpf. maf expression is present in the pronephros at 12 hpf and the proximal tubules at 24 and 48 hpf. (D) The SUA2 SNP region drives expression of GFP in the proximal tubules at 48 hpf. (E) ChIP analysis of the HNF4α binding site at the SUA2 SNP region, a positive HNF4α site at ABCC6 and a negative HNF4α site at B-globin. Binding is shown relative to input chromatin. Bar graphs represent mean from three independent experiments. A one-way ANOVA test indicates a significant difference between the means of the SUA2 SNP region and the negative binding site in B-globin. There is no difference between the positive ABCC6 site and the SUA2 SNP region. Error bars denote standard error of the mean and asterisks indicate significance: ∗p < 0.005; ∗∗p < 0.005, ∗∗∗p < 0.0005. EXPRESSION / LABELING:
|