
- Title
-
Kif17 phosphorylation regulates photoreceptor outer segment turnover
- Authors
- Lewis, T.R., Kundinger, S.R., Link, B.A., Insinna, C., Besharse, J.C.
- Source
- Full text @ BMC Cell Biol.
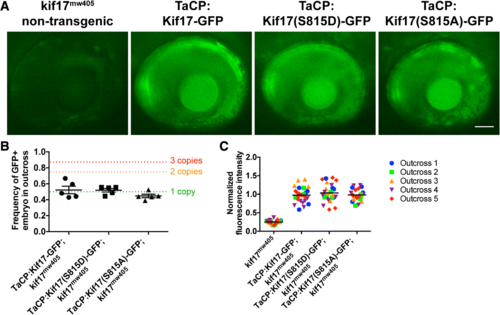
Establishment of stable lines of Kif17 transgenic zebrafish. a The three stable transgenic lines of zebrafish were outcrossed to kif17mw405 zebrafish. At 4dpf, zebrafish embryos were screened with epifluorescence to ensure virtually identical levels of expression among the three lines: Kif17-GFP, Kif17(S815D)-GFP, and Kif17(S815A)-GFP. Of note, the bright band of fluorescence at the back of the eye corresponds to the cone photoreceptors that are specifically expressing each of the three transgenes through TaCP, the cone-specific promoter. Additionally, each of the transgenic zebrafish have a significantly higher level of fluorescence than the autofluorescence observed in non-transgenic kif17mw405 zebrafish. For any experiment using the stable transgenic lines of zebrafish, screening is performed to verify the virtually identical level of expression. Scale bar is 50 μm. b For generation of the three stable transgenic lines of zebrafish, several generations of outcrossing to kif17mw405 zebrafish were performed to ensure there was only a single genomic insert of each transgene. Following independent assortment and Mendelian inheritance, the frequency of transgene inheritance in an outcross can be used to determine the insert or copy number of each transgene according to: , where n = copy number. Thus, a single insert would be inherited 50% of the time (green dotted line), two inserts would be 75% of the time (orange dotted line), and three inserts would be 87.5% of the time (red dotted line). Of note, the frequency of transgene inheritance for each of the three stable lines, TaCP:Kif17-GFP (n = 5 outcrosses, 203 total embryos screened), TaCP:Kif17(S815D)-GFP (n = 5 outcrosses, 231 embryos), and TaCP:Kif17(S815A)-GFP (n = 5 outcrosses, 279 embryos), is ~ 50%, suggesting that each of the stable transgenic lines contain only a single insert. One-way ANOVA was performed to show that there is no statistical significant difference among inheritance of each transgene (p = 0.2163). One sample t-test was performed to show that frequencies of TaCP:Kif17-GFP (p = 0.6579), TaCP:Kif17(S815D)-GFP (p = 0.4510), and TaCP:Kif17(S815A)-GFP (p = 0.0706) inheritance were not significantly different from 50%. c In addition to ensuring each of the stable lines was a single insert, we selected for stable transgenic lines that had a virtually identical level of fluorescence among them. The fluorescence intensity of each of the transgenes as well as a non-transgenic kif17mw405 zebrafish (n = 5 outcrosses, 25 total embryos each) was measured and normalized to the average fluorescence intensity of TaCP:Kif17-GFP. One-way ANOVA was performed to show that there is a statistical significant difference in fluorescence levels among the transgenic fish and the non-transgenic fish (p < 0.0001). A post-hoc Bonferroni analysis to compare groups was performed to show no significant differences between any of the transgenic fish (p > 0.9999), but a significant increase in fluorescence of the transgenic fish compared to the autofluorescence of a non-transgenic fish (p < 0.0001, ****) |
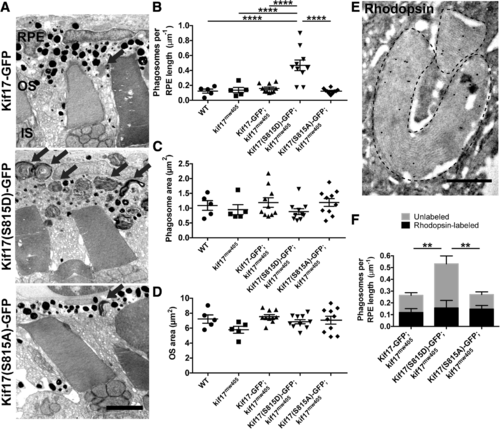
Phospho-mimetic Kif17(S815D) increases disc shedding. a TEM images of 7dpf kif17mw405 larvae that are stably expressing either Kif17-GFP (upper), phospho-mimetic Kif17(S815D)-GFP (middle), or phospho-deficient Kif17(S815A)-GFP (lower) in cones collected at ZT 1.5. Black arrows indicate phagosomes. Scale bar is 2 μm. IS is inner segment. b Quantification of the number of phagosomes for wild-type (n = 5 larvae, 1273 μm of RPE length); kif17mw405 (n = 5, 1170 μm of RPE length); Kif17-GFP, kif17mw405 (n = 10, 2677 μm of RPE length); Kif17(S815D)-GFP, kif17mw405 (n = 10, 2938 μm of RPE length); and Kif17(S815A)-GFP, kif17mw405 (n = 10, 2875 μm of RPE length) larvae. c Quantification of the area of phagosomes for wild-type (n = 5 larvae, 403 phagosomes); kif17mw405 (n = 5, 392 phagosomes); Kif17-GFP, kif17mw405 (n = 10, 530 phagosomes); Kif17(S815D)-GFP, kif17mw405 (n = 10, 1601 phagosomes); and Kif17(S815A)-GFP, kif17mw405 (n = 10, 547 phagosomes) larvae. d Quantification of OS size for wild-type (n = 5 larvae, 268 OS); kif17mw405 (n = 5, 255 OS); Kif17-GFP, kif17mw405 (n = 10, 615 OS); Kif17(S815D)-GFP, kif17mw405 (n = 10, 566 OS); and Kif17(S815A)-GFP, kif17mw405 (n = 10, 605 OS) larvae. e Immunogold labeling of a 7 dpf TaCP:Kif17-GFP zebrafish retina with K62-171c, an antibody against bovine rhodopsin showing a positive labeling of phagosomes (outlined with dashed lines), as also depicted in Additional file 1: Figure S7. Scale bar is 0.5 μm. f Analysis of immunogold labeling of rhodopsin-containing or unlabeled phagosomes in 7 dpf Kif17-GFP, kif17mw405 (n = 5 larvae, 1031 μm of RPE); Kif17(S815D)-GFP, kif17mw405 (n = 5, 1268 μm of RPE); and Kif17(S815A)-GFP, kif17mw405 (n = 5, 889 μm of RPE) larvae. Two-way ANOVA was performed to determine significance in the interaction between the transgene expressed and the concentration of rod or cone phagosomes (p = 0.0264, *) as well as significance in the total number of phagosomes between transgenes (p = 0.0071, **). Bonferroni’s multiple comparisons post-hoc test was performed to determine significance in the differences of unlabeled phagosomes between Kif17-GFP and Kif17(S815D)-GFP (p = 0.0033, **) and between Kif17(S815A)-GFP and Kif17(S815D)-GFP (p = 0.0013, **). There were no differences in numbers of rhodopsin-labeled phagosomes among the transgenes |