
- Title
-
Functional equivalence of germ plasm organizers
- Authors
- Krishnakumar, P., Riemer, S., Perera, R., Lingner, T., Goloborodko, A., Khalifa, H., Bontems, F., Kaufholz, F., El-Brolosy, M.A., Dosch, R.
- Source
- Full text @ PLoS Genet.
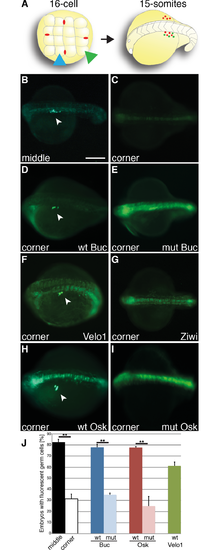
(A) Scheme of germ cell induction assay. Left panel: Animal view of a 16-cell embryo injected with PGC-reporter into a middle blastomere (blue arrowhead) containing endogenous germ plasm (red dots) or into a somatic cell (corner blastomere; green arrowhead). Right panel: Oblique, dorsal view of a 15-somite stage embryo (18 hours post fertilization, hpf), anterior to the left. Fluorescent germ cells (white arrowhead) emerge by targeting the reporter to a PGC or transforming a somatic cell into a PGC. (B, C) Live 18 hpf embryo after injection of PGC-reporter into a middle (B; 83±2.4%; n = 70) or corner blastomere (C; 31±4.5%; n = 70; p = 0.005). As previously shown, the gfp-nos3’UTR reporter also frequently labeled the midline at this stage [33]. (D, E) Wild-type Buc (aa1-639) reprograms the somatic corner blastomere to the germline (D; wt = 78±2.6%; n = 71), but not mutant Buc (Bucp43). Bucp43 mRNA sequence is identical to wt, but carries a point mutation (Y362STOP) [17] (E; mut = 35±1.6%; n = 68; p = 0.001). (F, G) Xenopus Velo1 acts as a functional homolog (F; 61±3.5%; n = 41) but not zebrafish Ziwi (G). (H, I) Drosophila sOsk induces germ cell formation (H; wt = 78±1.1%; n = 81), but not mutant sOsk084 (aa139-254) (I; mut = 25±8.7%; n = 62; p = 0.01). Scale bar (B-I): 200 μm. (J) Quantification of injection results (three independent experiments for each RNA). Error bars represent standard deviation of the mean. Student’s t-test; P-value: **<0.01. |
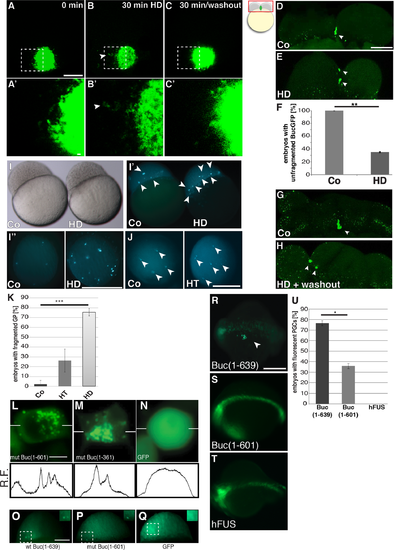
Pharmacological disruption of IDR-interactions leads to partially fragmented Buc-GFP aggregates. (A-C) Balbiani body of living Buc-GFP transgenic oocytes, either before (A), after a 30 min treatment with 5% 1,6-hexanediol (HD) (B), or 30 min after washout of the drug (lateral view, animal to the top). Arrowheads in B and B' indicate Buc-GFP granule outside the Balbiani body. Scale bar (A-C): 20 μm (A'-C'): 2 μm. (D-K) Germ plasm of transgenic Buc-GFP embryos after hexanediol treatment (HD). (D, E) lateral view of living 2-cell embryo as shown in boxed area of icon. Control embryos show unfragmented Buc-GFP aggregates (green) (D arrowhead), whereas 5% hexanediol for 30 min leads to fragmentation(arrowheads). (F) Quantification of embryos with unfragmented Buc-GFP in control (Co; 100±0%; n = 20) and embryos treated for 30 min with hexanediol (HD; 35.0±0.8%; n = 20; p = 0.0065). Student's t-test; P-value: **<0.01. (G, H) lateral view of living 4-cell embryos. Control embryo with unfragmented BucGFP (green, arrowhead), whereas Buc-GFP stays fragmented 30 min after washout of hexanediol (green; arrowheads). Scale bar (D-H): 100 μm. (I-K) Buc-GFP aggregates in 3 hpf embryos transgenic for Buc-eGFP. (I) The morphology of control (Co) and hexanediol-treated embryos (HD). Lateral view, animal to the top. (I', I'') Fragmented Buc-GFP aggregates (white arrowheads) persist until 3 hpf (I') lateral view, (I'') animal view. (J) Treatment with hexanetriol (HT) also leads to fragmented germ plasm (right embryo in J; animal view). Scale bar (I-J): 500 μm. (K) Quantification of germ plasm fragmentation (more than four puncta) at 3 hpf in controls (Co; 2.2±3.9%; n = 45), hexanetriol (HT; 26.3±11.5; n = 45) and hexanediol (HD; 75.5±3.9; n = 45; p = 1.9e-08). Error bars represent standard deviation of the mean. Student’s t-test; P-value: ***<0.001. (L-N) Protein aggregates upon transfection of HEK cells with (L) Buc(aa1-601)-GFP (50.32±2.95%; n = 70 percentage of transfected cells showing aggregated GFP signal), (M) Buc(aa1-361)-GFP (77.9±8.8%; n = 89) and (N) GFP (0%; n = 81). Scale bar (L-N): 10μm. (O-Q) Buc aggregation in zebrafish embryos. Embryos at 3 hpf after injection of mRNA encoding wt Buc(aa1-639)-eGFP (O), Buc(aa1-601)-eGFP (P) or eGFP(Q) at the one cell stage (lateral view, animal to the top). Scale bar (O-Q): 200 μm. Note the aggregation of wt Buc (aa1-639) and Buc (aa1-601) compared to GFP (insets; 25x magnification of stippled box). (R-U) IDRs are not sufficient for germ cell induction. Embryos form germ cells (white arrowheads) after injection with wt buc mRNA (aa 1–639) (R; 76.6±2.3%; n = 60), but less with mutant Buc (K; aa1-601) containing most IDRs (S; 35.9±2.6%; n = 60; p = 0.04) or an unrelated IDP (human FUS; T; 0±0; n = 26). Scale bar (J-L): 200 μm. (I) Quantification of injection results (three independent experiments for each RNA). Error bars represent standard deviation of the mean. Student’s t-test; P-value: *<0.05. |
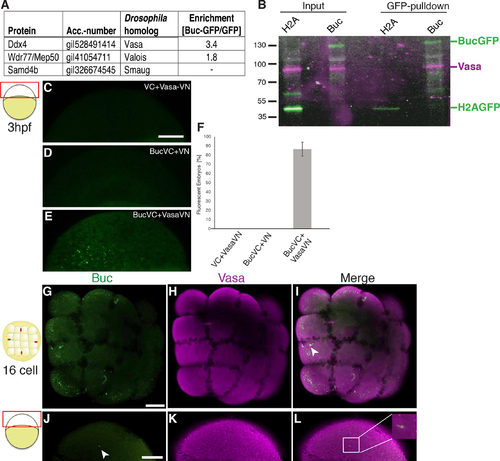
Buc binds zebrafish Vasa. (A) Zebrafish homologs of known Oskar binding proteins in the Buc-interactome detected Vasa (Ddx4) and Valois (Wdr77/Mep50), but not Smaug (Samd4b). Enrichment indicates the ratio of unique peptide counts after Buc-GFP pulldown to GFP-control samples. (B) Buc binds to Vasa in vivo during germ cell specification. Immunoprecipitations from 3 hpf H2A-GFP (42 kD) or Buc-GFP (130 kD) transgenic embryos blotted with GFP (green) and Vasa (magenta) (input = 20% of pulldown). (C-F) Buc and Vasa interact in bimolecular fluorescent complementation assays (BiFC). (C-E) live embryos at 3 hpf as indicated by the cartoon on the left, are not fluorescent (green) upon injection of mRNA encoding VC with Vasa-VN (C; 0±0%; n = 67) or Buc-VC with VN (D; 0±0%; n = 56), but form fluorescent Venus protein with Buc-VC and Vasa-VN (E; 86.5±7.5%; n = 53). Scale bar (C-E): 100 μm. (F) Quantification of BiFC assay (three independent experiments for each RNA). Error bars represent standard deviation of the mean. (G-L) Immunostaining of 16-cell stage (G-I) or 3 hpf (J-L) embryo as indicated by the cartoon on the left showing expression of Buc (green) and Vasa (magenta), inset in (L) shows a 10x magnification of the boxed area. Scale bar (G-L): 200μm. |

Zebrafish Vasa induces germ cells and binds to Drosophila Osk. (A-C) 16-cell assay showing germ cell formation (white arrowhead) after injection with vasa mRNA (A; 73.9±5.3%; n = 60; p = 0.01) but not with hermes (B; 22.9±4.8%; n = 60). Scale bar (A, B 200 μm (C) Quantification of injection results (three independent experiments for each RNA). Error bars represent standard deviation of the mean. Student’s t-test; P-value: **<0.01. (D) Western blot of Buc-GFP, Osk-GFP, and GFP-control together with Vasa after in vitro translation (input = 40% of pulldown) and after GFP-pulldown. Vasa (upper panel, magenta in merged panel) interacts with Buc and Osk, but not GFP controls (middle panel, green in merged panel). (M: molecular weight marker lane) (E) Western blot of Buc-GFP, Bucp43-GFP (1–361), and Bucp106-GFP (1–601) (middle panel, green in merged panel) together with Vasa (upper panel, magenta in merged panel) after in vitro translation (input = 40% of pulldown) and after GFP-pulldown. Vasa interacts with Buc, Buc(1–361) and Buc(1–601). |
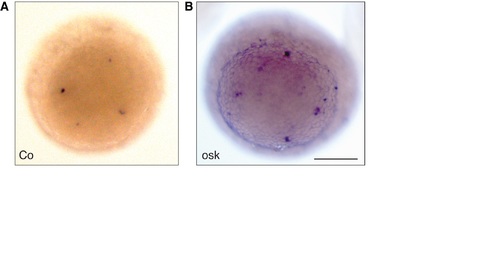
Drosophila Oskar induces Vasa mRNA positive cells in zebrafish. In situ hybridization for vasa mRNA (blue) in 3 hpf embryos in animal view after injection of control (GFP; A) or oskar mRNA (B). Note the additional Vasa-positive germ cells (blue) after Oskar overexpression and the overall higher background after staining for the same period. Scale bar: 200 μm. |