
FIGURE SUMMARY
- Title
-
Dietary Supplementation With ω6 LC-PUFA-Rich Algae Modulates Zebrafish Immune Function and Improves Resistance to Streptococcal Infection
- Authors
- Nayak, S., Khozin-Goldberg, I., Cohen, G., Zilberg, D.
- Source
- Full text @ Front Immunol
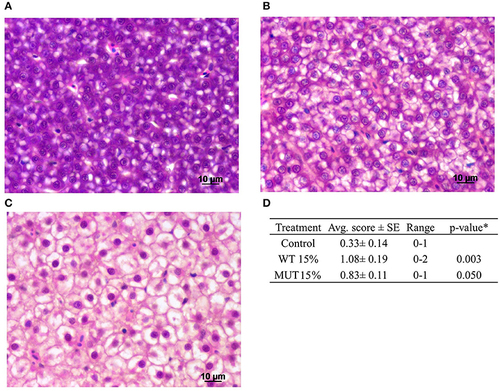
Figure 6. Histopathological analysis of zebrafish liver after feeding with modified experimental diets. Liver cells showing varying degrees of vacuolization are presented: (A) normal, scored 0; (B) moderate, scored 1; (C) high, scored 2. (D) Summary of quantitative analysis of the histological findings, showing average (Avg. score) and range of scores for the different treatment groups (n = 12 fish per treatment). *To compare treatment groups with the control, a one-way ANOVA was used. |
Acknowledgments
This image is the copyrighted work of the attributed author or publisher, and
ZFIN has permission only to display this image to its users.
Additional permissions should be obtained from the applicable author or publisher of the image.
Full text @ Front Immunol