
- Title
-
Metabolic Plasticity Enables Circadian Adaptation to Acute Hypoxia in Zebrafish Cells
- Authors
- Sandbichler, A.M., Jansen, B., Peer, B.A., Paulitsch, M., Pelster, B., Egg, M.
- Source
- Full text @ Cell Physiol. Biochem.
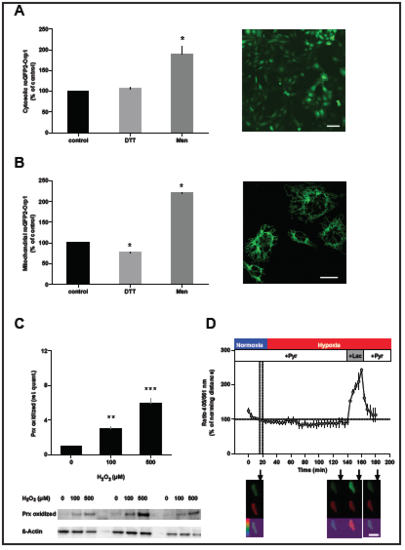
A and B: responsiveness of the roGFP2-ORP1 fluorescent protein sensor in the cytosolic (A) or mitochondrial (B) measurement setup was confirmed by applying either 1mM Dithiothreitol (DTT), an antioxidant as negative control, or 100 µM Menadione, a free radical generator as positive control; Significant differences (ANOVA, P< 0,05) between the treatment groups are shown (mean ± SEM; A: n=6; B: n=3); image A: Z3 cells with stable transfection of roGFP2-ORP1 in the cytosol, image B: Z3 cells with stable transfection of roGFP2-ORP1 localized to the mitochondria. Scale bar: 25 µm; C: Prx oxidized positive controls: Prx oxidized increases significantly with increasing concentrations of H 2O2in the medium, while ß-actin does not (mean ± SEM, n=3; one way ANOVA, Graph Pad Prism 6); D: equilibrium experiment: relative cytosolic levels of NADH for determination of the equilibrium state of the cytosolic reaction Pyruvate + NADH + H+ <—> Lactate + NAD+ were measured with the Peredox-mCherry sensor transiently transfected in Z3 cells. The sensor was excited at two wavelengths (Ex1 405 nm, Em1 500-550 nm, Ex2 561 nm, Em2 600–650 nm) to produce two images which were used for ratiometric image analysis; cells under normoxia and after two hours of hypoxia do not differ significantly in their ratio; at the end of the experiment imaging buffer containing 5 mM galactose and 5 mM pyruvate was exchanged to a buffer containing 5 mM galactose and 5 mM lactate to serve as a positive control for the sensor in a nonequilibrium state (high NADH concentration); inserts show a representative cell at 4 different timepoints (20 min, 135 min, 155 min, 180 min) in green and red emission and the ratio image in glow scale (ratio values 0-2); Scale bar: 40 µm; mean ± SEM (n=3); asterisks mark significant differences between the groups. |