
FIGURE SUMMARY
- Title
-
Mosaic RAS/MAPK variants cause sporadic vascular malformations which respond to targeted therapy
- Authors
- Al-Olabi, L., Polubothu, S., Dowsett, K., Andrews, K.A., Stadnik, P., Joseph, A.P., Knox, R., Pittman, A., Clark, G., Baird, W., Bulstrode, N., Glover, M., Gordon, K., Hargrave, D., Huson, S.M., Jacques, T.S., James, G., Kondolf, H., Kangesu, L., Keppler-Noreuil, K.M., Khan, A., Lindhurst, M.J., Lipson, M., Mansour, S., O'Hara, J., Mahon, C., Mosica, A., Moss, C., Murthy, A., Ong, J., Parker, V.E., Rivière, J.B., Sapp, J.C., Sebire, N.J., Shah, R., Sivakumar, B., Thomas, A., Virasami, A., Waelchli, R., Zeng, Z., Biesecker, L.G., Barnacle, A., Topf, M., Semple, R.K., Patton, E.E., Kinsler, V.A.
- Source
- Full text @ Journal of Clin. Invest.
(
|

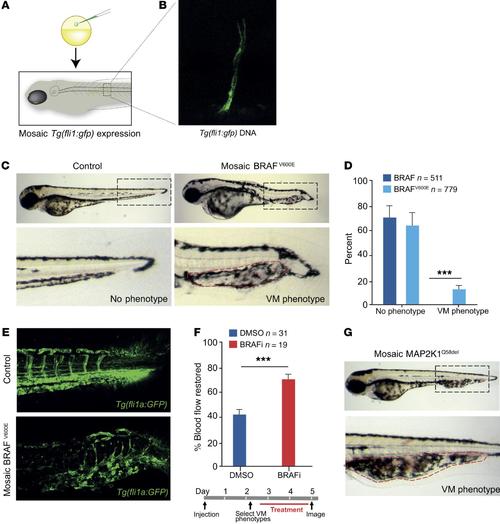
the effects of BRAF overexpression on tail development in zebrafish larvae. (a) Image of an example of a zebrafish larvae expressing high levels of MAPK signaling, leading to a "stunting" phenotype, as previously described(1, 2) (b) Graph of zebrafish embryos expressing BRAF WT or V600E alleles. Both WT and mutant alleles lead to a stunted phenotype that confounds analysis of the vasculature in those animals, and were excluded from further analysis. |
Acknowledgments
This image is the copyrighted work of the attributed author or publisher, and
ZFIN has permission only to display this image to its users.
Additional permissions should be obtained from the applicable author or publisher of the image.
Full text @ Journal of Clin. Invest.