
- Title
-
Green fluorescent genetically encoded calcium indicator based on calmodulin/M13-peptide from fungi
- Authors
- Barykina, N.V., Subach, O.M., Piatkevich, K.D., Jung, E.E., Malyshev, A.Y., Smirnov, I.V., Bogorodskiy, A.O., Borshchevskiy, V.I., Varizhuk, A.M., Pozmogova, G.E., Boyden, E.S., Anokhin, K.V., Enikolopov, G.N., Subach, F.V.
- Source
- Full text @ PLoS One
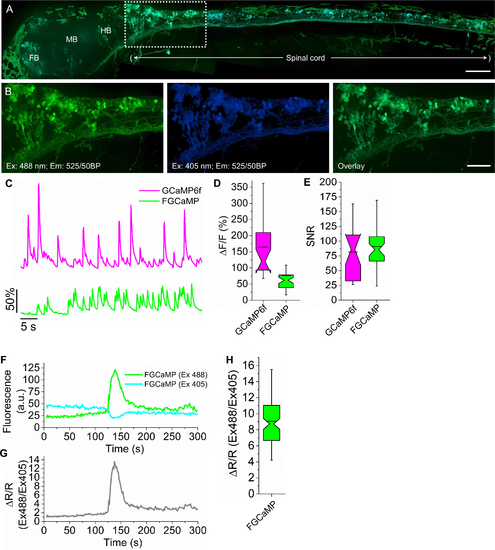
Calcium imaging of neurons expressing FGCaMP in zebrafish larva at 4 days post fertilization. (A) Overlay of confocal fluorescence images of neurons expressing FGCaMP, acquired with 488 and 405 nm excitation and 525/50BP emission. White box indicates area zoomed-in in panel B. Scale bar, 100 μm. FB, forebrain; MB, midbrain; HB, hindbrain. (B) High magnification images of the neurons highlighted in the white box in panel A acquired with 488 nm excitation and 525/50BP emission (left; green pseudocolor) and 405 nm excitation and 525/50BP emission (middle; blue pseudocolor), and overlay of the left and middle images (right). Scale bar, 50 μm. (C) Representative single cell recording of GCaMP6f (top; magenta) and FGCaMP green fluorescence responses (bottom; green) during 4-aminopyridine induced neuronal activity (Ex: 475/34BP, Em: 527/50BP). Population data for (D) maximum fluorescence changes ΔF/F and (E) SNR corresponding to the experiment in panel C (26 neurons in 3 fish and 43 neurons from 5 fish for GCaMP6f and FGCaMP, respectively). Box plots with notches are used (narrow part of notch, median; top and bottom of the notch, 95% confidence interval for the median; top and bottom horizontal lines, 25% and 75% percentiles for the data; whiskers extend to 5th and 95th percentile for the data; horizontal bar is mean). (F) Representative single cell recording of FGCaMP green fluorescence excited with 488 and 405 nm laser illumination during 4-aminopyridine induced neuronal activity. (G) Fluorescence ratio for the traces shown in panel F. (H) Population data for fluorescence ratio for experiment in panel C (107 neurons in 2 fish). Box plots with notches are used (see panel D for description). |
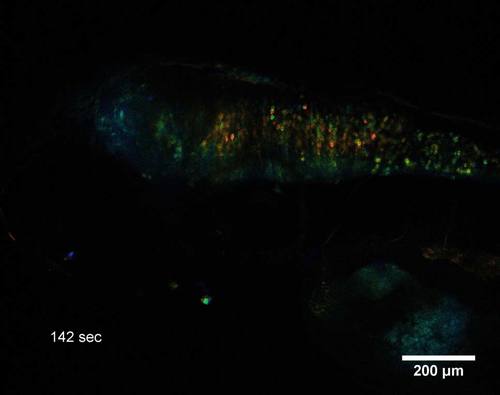
Confocal ratiometric calcium imaging with FGCaMP during 4-AP induced neuronal activity in paralyzed larvae embedded in ultra-low-melting agarose gel. Example of frame from S1 Video is shown. |
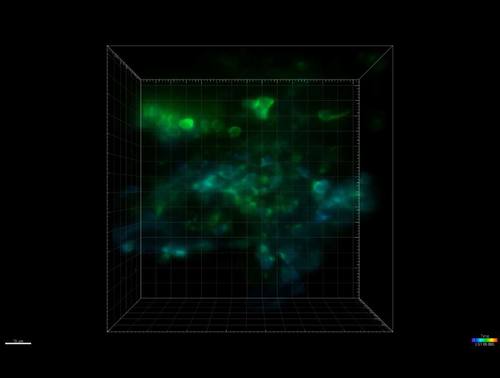
Light sheet ratiometric calcium imaging with FGCaMP during 4-AP induced neuronal activity in paralyzed larvae embedded in ultra-low-melting agarose gel. Example of frame from S2 Video is shown. |