
- Title
-
Mutual Regulation of NOD2 and RIG-I in Zebrafish Provides Insights into the Coordination between Innate Antibacterial and Antiviral Signaling Pathways
- Authors
- Nie, L., Xu, X.X., Xiang, L.X., Shao, J.Z., Chen, J.
- Source
- Full text @ Int. J. Mol. Sci.
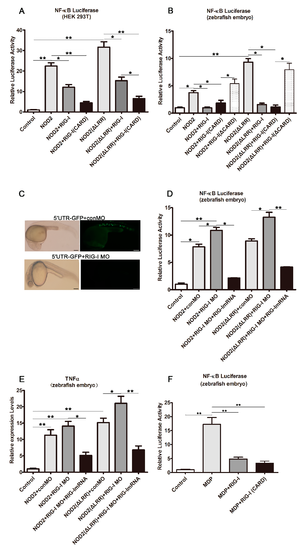
DrRIG-I negative regulation of the DrNOD2-initiated signaling. (A,B) DrRIG-I negatively regulated DrNOD2-activated NF-κB signaling in HEK293T cells (A) and zebrafish embryos (B). HEK293T cells (1 µg/mL) or one-cell stage embryos (100 pg/embryo) were administered with DrNOD2 or DrNOD2 (ΔLRR). The cells/embryos were collected at 24 h post transfection/injection. Luciferase assays showed robust NF-κB activation. This activation was evidently inhibited when DrRIG-I or DrRIG-I-CARD was co-administered with DrNOD2 or DrNOD2 (ΔLRR). However, no inhibition was observed in the DrRIG-I (ΔCARD) co-administered group; (C) Examination of knockdown efficiency of DrRIG-I MO. The 5′ UTR sequence (complement to the MO sequence) of DrRIG was amplified and inserted into the EGFP-N1 vector. One-cell stage embryos were injected with the constructed vector (100 pg/embryo) and the control MO or DrRIG MO (4 ng/embryo). The embryos were collected at 24 hpi, and phase contrast images and GFP fluorescence were observed to examine the knockdown efficiency, scale bar, 400 µm; (D,E) The role of DrRIG-I in DrNOD2-initiated signaling was confirmed via MO-mediated knockdown and mRNA rescue in zebrafish embryos. One-cell stage embryos were injected with DrNOD2 or DrNOD2 (ΔLRR) (100 pg/embryo) and control MO or DrRIG MO (4 ng/embryo) or together with DrRIG mRNA (100 pg/embryo). At 24 hpi, NF-κB activation and TNFα production were elevated when DrRIG-I MO was co-administered. Good rescue was achieved with the simultaneous injection of DrRIG-I Mrna; (F) DrRIG-I negatively regulated MDP-initiated NOD2 signaling in zebrafish embryos. One-cell stage embryos were administered with 2 nL (1 µg/μL) of MDP. The embryos were collected at 24 hpi. Luciferase assay results showed robust NF-κB activation, which was inhibited by the co-administration of MDP with DrRIG-I or DrRIG-I-CARD. All luciferase assays and qRT-PCR were conducted with three replicates, and each replicate contained the extracts from the cells of a well from the six-well plate or 80–100 zebrafish embryos. Values are expressed as mean ± SD; * p < 0.05, ** p < 0.01. |