
- Title
-
Yap/Taz transcriptional activity is essential for vascular regression via Ctgf expression and actin polymerization
- Authors
- Nagasawa-Masuda, A., Terai, K.
- Source
- Full text @ PLoS One
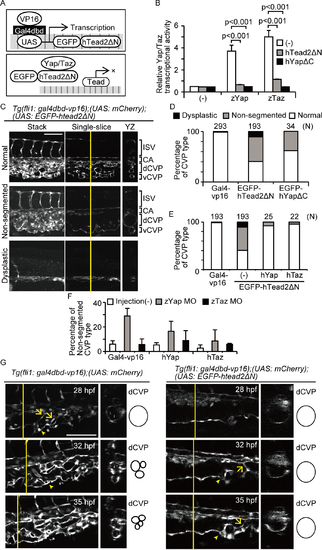
Yap/Taz transcriptional activity is essential for dCVP regression. (A) Schemas represent the model of dominant-negative expression. (B) HEK293T cells were transfected with pFR-Luc and pcDNA3.1-Gal4-hTead2ΔN. Cells were also introduced with p3xflag-cmv-14-zYap, -zTaz, pEGFP-hTead2ΔN, and -hYapΔC as indicated. Cells were harvested 24 hours after transfection and measured the luciferase activity. Data are means and SDs (n = 3). (C and D) Images of Tg(fli1: gal4dbd-vp16);(UAS: mCherry);(UAS: EGFP-htead2ΔN) at 35 hours post-fertilization (hpf) are shown. Cross-sectional images of the plane indicated by the yellow lines (right) also shown. White color represents mCherry signals. Scale bars: 100 μm. CA, caudal artery; dCVP, dorsal part of the CVP; vCVP, ventral part of the CVP; ISV, intersegmental vessel. The results including Tg(fli1: gal4dbd-vp16);(UAS: EGFP-hyapΔC) were quantitated and shown as (D). The result of Tg(fli1: gal4dbd-vp16);(UAS: mCherry) is shown as Gal4-vp16. (E) Tg(fli1: gal4dbd-vp16);(UAS: EGFP-hTead2ΔN) fish were crossed with Tg(UAS: EGFP-hyap) or (UAS: EGFP-htaz) and analyzed as in (D). (F) Embryos were injected with morpholino for zYap or zTaz. The percentage of fish with non-segmented CVPs at 31 hpf is shown. The numbers of embryos analyzed is at the top of each bar. The result of Tg(fli1: gal4dbd-vp16);(UAS: mCherry) is shown as Gal4-vp16. (G) Single-slice and cross-sectional images of indicated embryos are shown. Arrows indicate endothelial cells sprouting into the lumen. Arrowheads indicate vCVP formation. White color shows mCherry signals. Scale bars: 100 μm. |
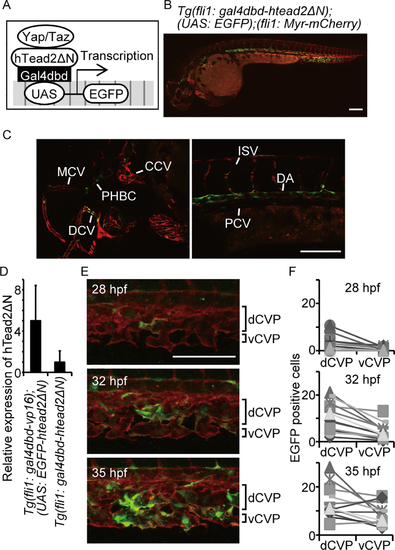
Yap/Taz is transactivated in the CVP during dCVP regression. (A) Schema for detecting Yap/Taz transcriptional activity is shown. (B and C) Confocal stack image of a Tg(fli1: gal4dbd-htead2ΔN);(UAS: EGFP);(fli1: Myr-mCherry) embryo at 36 hpf is shown. The EGFP signal is shown in green and mCherry in red. Scale bar: 100 μm. Enlarged images in (B) are also shown: head (left), dorsal area (right). CCV, common cardinal vein; PHBC, primordial hindbrain channel; DCV, dorsal ciliary vein; MCV, middle cerebral vein; DA, dorsal aorta; PCV, posterior cardinal vein. (D) The relative expression of hTead2ΔN mRNA in the indicated embryos are shown. Data are means and SDs (n = 3). (E and F) Representative images of the indicated embryo are shown. Scale bar: 100 μm. The numbers of EGFP-positive cells were counted in the dCVP and vCVP from 12 embryos. |
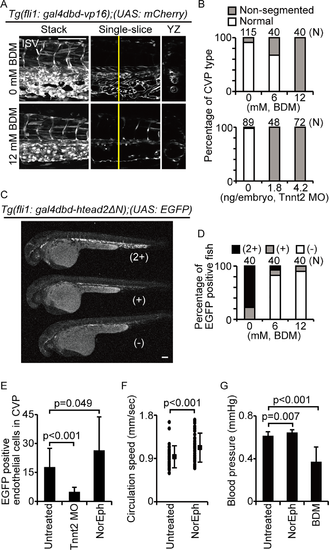
Yap/Taz is activated by blood flow in the CVP. (A and B) Images of mCherry intensity in indicated embryos at 36 hpf are shown. Embryos were treated with or without 12 mM BDM from 28–36 hpf and quantified. Scale bars: 100 μm Similar experiments were performed with morpholino for Tnnt2. (C and D) Representative images of EGFP signal levels in indicated embryos at 36 hpf are shown. Signal intensity was qualitatively categorized as low (−), intermediate (+), or high (2+), as shown. Scale bar: 100 μm. (E) The number of EGFP-positive cells in Tg(fli1: gal4dbd-htead2ΔN);(UAS: EGFP) embryo in CVP at 32 hpf are shown. Untreated embryos are shown as control (n = 14). Some embryos were treated with Tnnt2 MO (n = 18). Some embryos were treated with 1mM norepinephrine (NorEph) (n = 17). (F) Circulation speed of blood cells in fish treated with 1mM norepinephrine were measured as described materials and methods section. Each dot indicates the circulation speed of blood cells in one control embryo (n = 7) or norepinephrine-treated embryo (n = 10). Solid squares and error bars represent means and SDs. (G) Blood pressure in fish treated with 1mM norepinephrine or 12 mM BDM were measured. Data are means and SDs for the control (n = 24), norepinephrine treatment (n = 18), and BDM treatment (n = 7). |
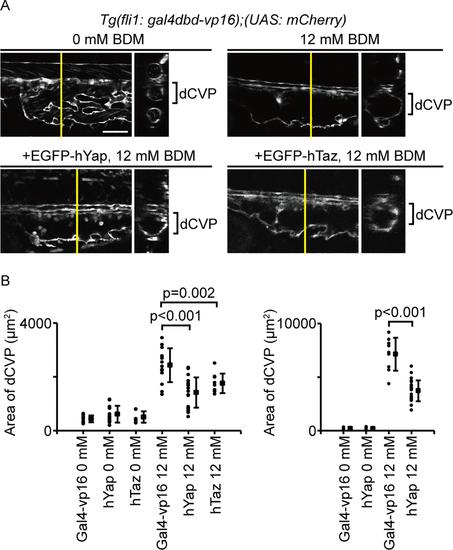
Yap/Taz transcriptional activity controls vascular shrinking during dCVP regression. (A) Embryos were treated with or without 12 mM BDM from 28–36 hpf. Lateral single-slice images of the CVP region in indicated embryos at 36 hpf are shown. Cross-sectional images in the plane indicated by the yellow lines are shown to the right. White color shows mCherry signals. Scale bars: 100 μm. (B) Embryos were treated with or without 12 mM BDM from 28–36 hpf and 28–48 hpf, respectively. Each dot represents one embryo, and solid squares and error bars represent means and SDs. |
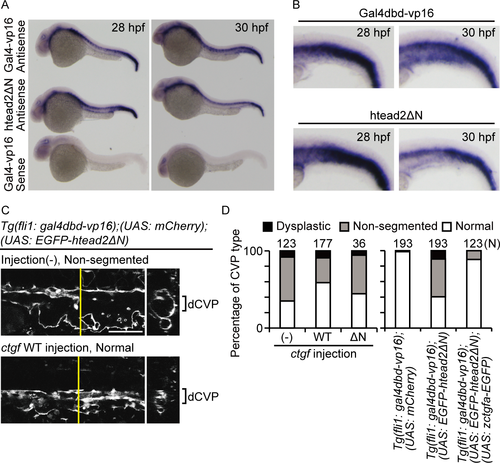
Ctgf expression depends on Yap/Taz transcriptional activity in the CVP and is required for dCVP regression. (A and B) Expression patterns of ctgf mRNA at 28 and 30 hpf are shown. Embryos of Tg(fli1: gal4dbd-vp16);(UAS: EGFP-hTead2ΔN) and Tg(fli1: gal4dbd-vp16) are indicated as hTeadΔN and Gal4-vp16, respectively. A sense probe was used to confirm the specificity of the antisense probe reaction. Enlarged images in (A) are also shown. (C and D) Lateral single-slice images of the CVP region at 36 hpf are shown. Injection (-): embryos not injected; ctgf WT: injected with UAS-zctgfa-EGFP. White color shows mCherry signals. Scale bar: 100 μm. Quantified results are also shown. |
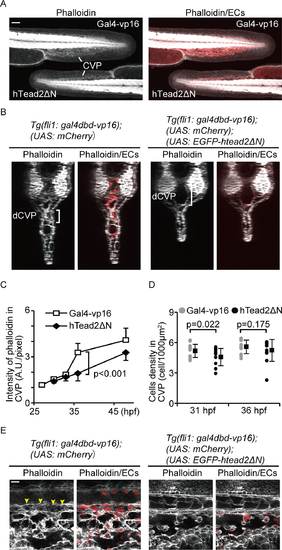
Actin polymerization is induced by Yap/Taz transcriptional activity in the CVP. (A, B, and C) Images of a phalloidin stain of indicated embryos at 36 hpf are shown. Embryos of Tg(fli1: gal4dbd-vp16);(UAS: EGFP-hTead2ΔN);(UAS: mCherry) and Tg(fli1: gal4dbd-vp16);(UAS: mCherry) are indicated as hTeadΔN and Gal4-vp16, respectively. White represents the phalloidin stain. Red indicates mCherry signals. Scale bars: 50 μm. Time-dependent change in the phalloidin stain during CVP formation were also analyzed and shown in (C). Solid squares and error bars represent means and SDs. (D) Cell densities of endothelial cells forming the CVP in embryos are shown. Each dot represents one embryo, and solid squares and error bars represent means and SDs. (E) Enlarged images of (A) are shown. Scale bar: 10 μm. |
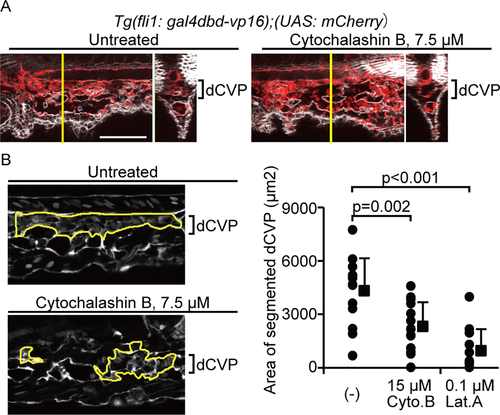
Actin polymerization is required for dCVP regression. (A) Image of phalloidin stain (white) merged with the mCherry signal (red) in indicated embryos treated with 0 μM or 7.5 μM Cytochalashin B from 30–37 are shown. Scale bars: 100 μm. (B) Representative images for gating of the segmented dCVP area in embryos are shown. The Tg(fli1: gal4dbd-vp16);(UAS: mCherry) embryos treated with 15 μM Cytochalasin B (Cyto.B) or 0.1 μM Latrunculin A (Lat.A) from 30–37 hpf. White color shows mCherry signals. Scale bars: 50 μm. The area of segmented dCVP, gated as indicated in (B) were quantified. The numbers of embryos analyzed are shown at the top of each bar. Each dot represents one embryo, and solid squares and error bars indicate means and SDs. |