
- Title
-
Histone Deacetylase Inhibitors Antagonize Distinct Pathways to Suppress Tumorigenesis of Embryonal Rhabdomyosarcoma
- Authors
- Vleeshouwer-Neumann, T., Phelps, M., Bammler, T.K., MacDonald, J.W., Jenkins, I., Chen, E.Y.
- Source
- Full text @ PLoS One
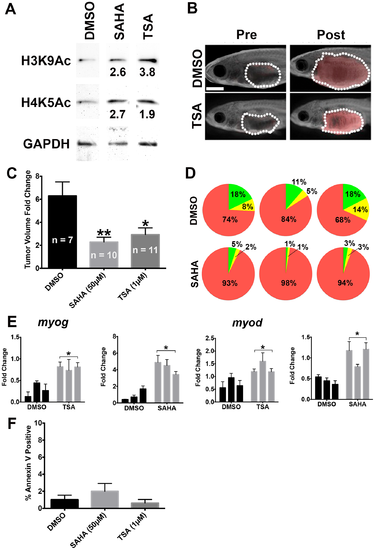
TSA and SAHA reduced tumor growth and induced myogenic differentiation in vivo. (A) Western blots demonstrating hyperacetylation of histone H3 (Lys9) and histone H4 (Lys5) in zebrafish ERMS treated with 1 μM TSA or 50 μM SAHA. GAPDH was used as loading control. The values shown represent fold change in band intensity from TSA or SAHA treatment relative to DMSO after normalizing to loading control. (B) Representative pre- and post-treatment images of zebrafish ERMS treated with DMSO (vehicle) or 1 μM TSA. Dotted line outlines the tumor in each fish. Scale bar = 2 mm. (C) Summary of tumor volume change of zebrafish Tg(myf5:GFP; mylz2:mCherry) ERMS treated with DMSO, 50 μM SAHA or 1 μM TSA. Overlaid images of bright field and red fluorescent channel are shown. Error bar indicates standard error of means. n = number of animals treated in each cohort. (D) Summary of quantitative Fluorescence Activated Cell Sorting analysis on ERMS treated with DMSO or 10 μM SAHA. Each pie chart shows relative proportion of each tumor cell subpopulation in an individual treated tumor. Green: myf5:GFP+/mylz2:mCherry−cells; yellow: myf5:GFP+/mylz2:mCherry+ cells; red: mylz2:mCherry+/myf5:GFP−cells. (E) Quantitative RT-PCR analysis of myog and myod mRNA expression in ERMS treated with DMSO, 1 μM TSA or 50 μM SAHA. Each bar demonstrates an individual tumor. Each error bar indicates standard deviation of technical triplicates. (F) Annexin V analysis of ERMS tumors treated with DMSO, 50 μM SAHA, or 1μM TSA. 6 animals were analyzed per group. Each error bar indicates standard deviation. * indicates p < 0.05. ** indicates p < 0.01. |