
- Title
-
A High-Content Larval Zebrafish Brain Imaging Method for Small Molecule Drug Discovery
- Authors
- Liu, H., Chen, S., Huang, K., Kim, J., Mo, H., Iovine, R., Gendre, J., Pascal, P., Li, Q., Sun, Y., Dong, Z., Arkin, M., Guo, S., Huang, B.
- Source
- Full text @ PLoS One

Round bottom 96-well plates preferentially orient larvae dorsal side down. (A) Zebrafish larvae must be oriented dorsal side down to image the brain region (boxed in red) using an inverted microscope. Larvae oriented side-down have their brains obscured by their large, pigmented eyes (scale bar = 500um). (B) Plots showing that round bottom 96-well plates preferentially orient fish dorsal side down for brain imaging (n = 80 larvae). (C) Approximately 90% of the larvae have at least one dorsal side-down image by the fourth reposing cycle (n = 46 larvae). (D) Maximum z-projection of 0.5um fluorescent beads used to characterize the aberrations caused by the round bottom well on an IN Cell 2000 system using a 4× 0.2 NA objective (scale bar: 1000um). Circled region indicates the typical area that a larval head rests, with the center of the circle marking the approximate center of the well. Insets show zoomed-in images of beads at different regions of the well. (i) and (ii) show no noticeable aberrations, whereas astigmatism and coma aberrations near the edges of the well are visible in (iii). |

Chemo-genetic model screening details. (A) Timeline showing the details of fish husbandry and chemical treatment. Larvae were treated with metronidazole at 3dpf and imaged in situ at 5dpf. (B) The nitroreductase-metronidazole method is able to specifically ablate dopaminergic neurons, which express mCherry, in 5dpf larvae (scale bar = 200um). Images are of zebrafish larvae in the dorsal-down position. (C) Anti-tyrosine hydroxylase and anti-GFP antibody staining of 3dpf zebrafish embryos show good overlap in the ventral forebrain region DA neurons. bfb DA, basal forebrain dopaminergic neurons; Po, preoptic region; sym NA, sympathetic noradrenergic neurons; Tel, telencephalon; retinal DA, retinal dopaminergic neurons. (D) Zoomed-in views of areas boxed in (C). |
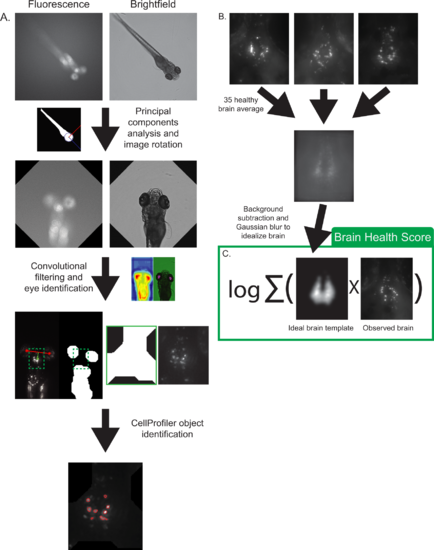
Image processing pipeline. (A) The fluorescence image is thresholded and a principal component analysis is used to rotate both images to a head-up position. The brightfield image is then thresholded and convolved with an eye-like filter to locate the eyes. The brain region is then identified using the eyes as landmarks, the image is cropped, and a maximum intensity z-projection is exported to CellProfiler for neuron identification. Red asterisks denote centroids of identified eye regions and the green box represents the final cropped area sent to CellProfiler for analysis. (B) Creation of an idealized brain template image. 35 healthy brains were registered and averaged in ImageJ. Background was subtracted and a Gaussian blur filter was applied to smooth and idealize the image. (C) The brain health score was defined as the logarithm of the covariance between an idealized brain template and an observed brain image. |