- Title
-
Visuomotor Transformations Underlying Hunting Behavior in Zebrafish
- Authors
- Bianco, I.H., Engert, F.
- Source
- Full text @ Curr. Biol.
|
2P Functional Calcium Imaging during Virtual Hunting Behavior in Larval Zebrafish (A) Schematic of experimental setup. Larval zebrafish are tethered in agarose gel but able to freely move their eyes and tail. Visual stimuli are presented by projection onto a miniature screen in front of the animal. A 2P microscope is used to image fluorescent calcium signals, and eye position is monitored simultaneously through the microscope objective using an infrared camera. (B) Eye position recorded before (left) and after (right) a predatory convergent saccade, during 2P imaging. (C) Neural activity recorded in the optic tecta of a Tg(elavl3:GCaMP5G) transgenic larva. The fractional change in fluorescence (Δ F/F) is shown in green (arbitrary color scale) overlaid on an anatomical projection of the focal plane (gray). This field-of-view corresponds to FOV2 as shown in Figure 3A. Dorsal view, anterior top. Scale bar, 50 µm. (D) Schematic of the behavioral assay (viewed from above). The animal is presented with visual stimuli that are projected onto a screen covering ~200° visual space. Scale bar, 2 mm. (E) Examples of eye-position records from two trials in two different larvae. The gray bar indicates the period during which the visual cue sweeps across visual space from +100° right to 100° left (top) or left-right (bottom). The different lengths of the bars correspond to different speeds of stimulus motion. The white tick indicates the time when the cue is at 0°, directly in front of the animal. The black symbol indicates the automatic detection of a convergent saccade. Downward deflection of eye position traces corresponds to clockwise eye rotation. |
|
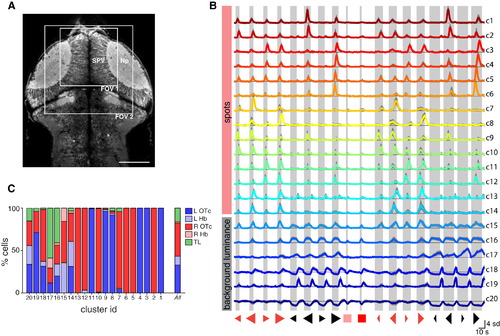
Clustering of Visual Response Properties (A) 2P focal plane showing a dorsal view of the brain of a 5 dpf Tg(elavl3:GCaMP5G) larva. Boxes indicate size and approximate locations of fields of view for functional imaging of the anterior optic tecta. The stratum periventriculare and synaptic neuropil regions of the right OTc are labeled. Anterior top. Scale bar, 100 µm. (B) Cluster centroids (mean visual response vectors) of 20 clusters of visually responsive neurons from 14 fish. For each cluster, the visual response vectors of constituent cells were divided by their SD (to normalize responses across cells with varying magnitudes of signal modulation), and the mean visual response vector was computed (colored lines). Thin black lines indicate zero ΔF/F. Gray shading indicates SD across cells. Numbers on the right are cluster IDs. Shaded bars indicate visual stimulus presentation periods. (C) Anatomical distribution of cells from each cluster. L, left; R, right; Hb, habenula; OTc, optic tectum; SPV, stratum periventriculare; Np, tectal neuropil; TL, torus longitudinalis. See also Figures S1–S3 and Table S1. |
|
Clusters Respond to Background Luminance Changes and Show Mixed Selectivity to Multiple Features of Moving Spot Stimuli (A) Cluster 16 shows positive modulation in response to increases in whole-field luminance. The left panel shows VRVs for every cell in the cluster (each row corresponds to one cell). Neurons show increased calcium signals in response to the increased background luminance that occurs in conjunction with presentation of dark, moving spots, as well as in response to large bright spots and whole-field light flashes. Middle panels show locations of cluster 16 cells in the habenula and torus longitudinalis, and right panels show anatomical locations of all detected cluster 16 neurons in two representative larvae. Neuron locations are marked as x-y centroids (colored spots) overlaid on a single anatomical image from the dorsoventral mid-point of the imaging volume. Many cluster 16 cells are located in the torus longitudinalis and the habenulae. Scale bars, 50 µm. (B and C) Mirror-symmetric pairs of clusters showing a net preference for large, bright, moving spots. (B) Clusters 9 and 10 are tuned to leftward-moving stimuli and localize to the left and right optic tecta, respectively. (C) Clusters 11 and 12 are tuned to rightward-moving stimuli. Histograms show distributions of feature selectivity indices for cells in each cluster. Arrows on anatomical maps indicate preferred direction of motion. (D and E) Clusters responding to large, dark, moving spots. (D) Clusters 1 and 2 are tuned to leftward-moving large, dark spots. (E) Clusters 3–6 prefer rightward-moving stimuli. These clusters were divided based on differential response times, corresponding to different spatial receptive field locations. Accordingly, they occupy different positions in the tectal space map. |
|
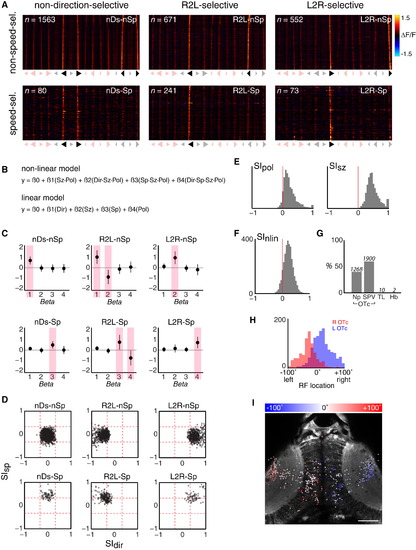
Tectal Neurons Show Non-linear Mixed Selectivity for Best Prey-like Stimuli (A) Visual response vectors (VRVs) of ROIs isolated using six regressors that were designed based upon the stimulus tuning of behavioral response rates. Symbols below each panel indicate the stimuli coded 1 in the binary vector defining the regressor. Stimuli coded 0 are shown in light shading. ROIs were associated with the regressor that produced the highest correlation coefficient, when that coefficient was 0.75 or greater. (B) Non-linear and linear models used to fit the response profiles of individual ROIs. y represents the fluorescence response (peak ΔF/F during stimulus presentation). Each stimulus is coded as a set of four binary feature values, as shown in Figure 2E. (C) Coefficients (β’s) derived from fitting the non-linear model in (B) to ROIs associated with each regressor. Shaded bars indicate coefficients expected to show significant non-zero values. Data are shown as mean ± SD. (D) Direction- and speed-selectivity indices (SIdir, SIsp) for ROIs associated with each regressor. (E) Polarity- and size-selectivity indices (SIpol, SIsz). (F) Comparison of model fits (R2) obtained with non-linear versus linear mixed selectivity models, quantified as a selectivity index, SInlin. The majority of ROIs show a positive index, indicating the non-linear model provides a more accurate description of the variance of their responses. (G) Anatomical distribution of ROIs. Values above each bar indicate number of ROIs. (H) Distribution of receptive field (RF) centers for NLMS neurons in the left (blue) and right (red) optic tecta. Only ROIs localized to the tectal SPV are shown. (I) Anatomical map of all NLMS ROIs in one example fish. Each spot indicates the centroid of an ROI, color-coded according to estimated RF location. ROIs located in both the tectal SPV and neuropil regions are shown. Note that for presentation, ROIs from the entire imaging volume are overlaid on a single anatomical image from the dorsoventral mid-point of the volume. Scale bar, 50 µm. See also Figure S4. |
|
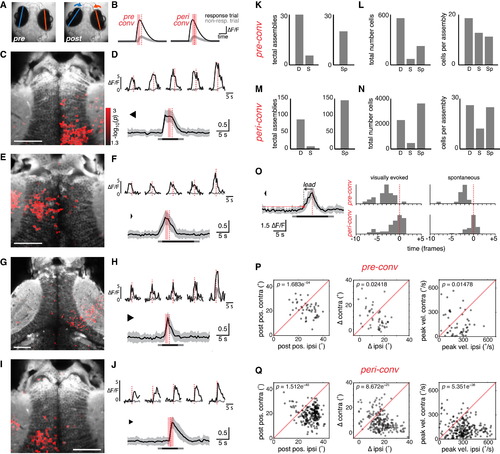
Assemblies of Tectal Neurons Show Premotor Activity Associated with Convergent Saccades (A) Eye position before and after a convergent saccade. (B) Schematic indicating time windows used to identify ROIs with a significantly greater GCaMP response immediately prior to a convergent saccade (“pre-conv”, left) or around the time of the saccade (“peri-conv”, right). Dashed red line indicates time of eye convergence in response trial. Shaded red bars indicate time windows during which activity (ΔF/F) was compared (t test) between response (black) versus non-response trials (gray). (C) Example of right tectal assembly that was active in advance of a convergent saccade (“pre-conv”). Response-modulated ROIs (red, color map indicates log-transformed p value from t test) are overlaid on an anatomical projection (gray). (D) Top: five cells from the assembly in (C). Activity in response trial in black, mean activity in non-response trials in gray. Bottom: activity of all cells in assembly in (C) during the response trial. To facilitate comparison of cells with different response amplitudes, we normalized ”F/F time courses to the maximum value for each cell before computing the population average, shown as mean ± SD. Bar indicates visual stimulus presentation (light gray, change in background luminance; dark gray, moving spot presentation). (E–H) Two more examples of “pre-conv” assemblies that were active in advance of convergent saccades. Assemblies are from two different fish that are also different from (C) and (D). (I) Left tectal assembly that was active around the time of a convergent saccade (“peri-conv”). Same fish as (C) and (D). (J) Responses of individual cells (top) and the whole assembly (bottom) shows activity coincident with, or immediately following, the convergent saccade. (K) Left: number of pre-conv assemblies identified in original data, “D” and after circular permutation of the timebase (shuffling, “S”). We estimated false discovery rate to be 19%. Right: number of pre-conv assemblies associated with spontaneous convergent saccades, “Sp”. (L) Total number of cells (left) and mean number of cells per assembly (right) for pre-conv assemblies. (M and N) Data for peri-conv assemblies, as per (K) and (L). False discovery rate was 9%. (O) Left: example illustrating detection of onset of assembly activity. Population activity of a pre-conv assembly is shown (mean ± SD). Horizontal red line indicates threshold. The population response crosses threshold at the time indicated by a red dot, which precedes the saccade by a certain lead time (arrow). Right: histograms of lead times for pre-conv (top) and peri-conv (bottom) assemblies associated with visually evoked (left) or spontaneous (right) convergences. x axis is marked in imaging frames, relative to time of saccade (frame zero). (P and Q) Oculomotor parameters associated with assembly activity. Post-saccadic eye position (left), change in eye position (middle), and peak nasal eye velocity (right) are compared for the eye ipsilateral to the assembly (ipsi) versus the eye contralateral to the assembly (contra). Positive values correspond to more nasal eye positions/rotations. For both types of assembly, the eye ipsilateral to the tectal assembly shows a larger post-saccadic eye position, a larger change in horizontal position and a larger peak velocity. p values obtained by paired t tests comparing ipsilateral versus contralateral eye. Data for visually evoked and spontaneous convergences are combined. See also Figures S5–S7. |


