
- Title
-
Subacute Microcystin-LR Exposure Alters the Metabolism of Thyroid Hormones in Juvenile Zebrafish (Danio Rerio)
- Authors
- Liu, Z., Tang, R., Li, D., Hu, Q., Wang, Y.
- Source
- Full text @ Toxins (Basel)
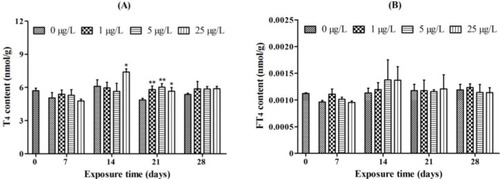
Whole-body content of ( |

Whole-body content of ( |

The effects of exposure to different concentrations of microcystin-LR (MC-LR) for 28 days on the histological structure of thyroid follicles in juvenile zebrafish; ( |
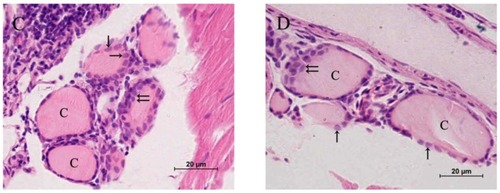
The effects of exposure to different concentrations of microcystin-LR (MC-LR) for 28 days on the histological structure of thyroid follicles in juvenile zebrafish; ( |

Thyroid follicle cell nuclear size following exposure of juvenile zebrafish to microcystin-LR (MC-LR) for 28 days ( |

Percent of hyperplasia follicles in juvenile zebrafish exposed to microcystin-LR (MC-LR) for 28 days ( |

Transcript abundance for ( |

The activity of ( |