
- Title
-
Learning the Scientific Method Using GloFish
- Authors
- Vick, B.M., Pollak, A., Welsh, C., and Liang, J.O.
- Source
- Full text @ Zebrafish
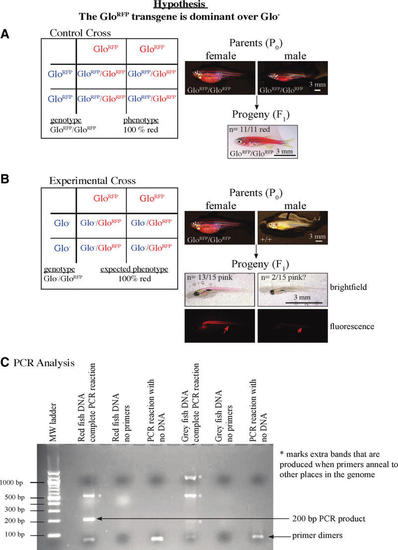
(A) Punnett square and images outlining the expected and observed phenotypes and genotypes of the parents and progeny of the control cross. All fish in this cross were homozygous for GloRFP, and thus red whether the transgene was dominant or recessive. Thus, it served as a control to ensure that red body color could be effectively detected. (B) Punnett square and images of the expected and observed phenotypes of the cross testing the hypothesis that the red color and red fluorescence (arrows) are dominant over the gray/no fluorescence. If the hypothesis was correct, the students expected all of the progeny to have a red body color and to be red fluorescent. (C) Example gel showing products from PCR genotyping. The expected 200 bp band for the RFP gene is present only in the lane with red fish DNA and all of the components of a PCR reaction. Several of the lanes have a very small “primer dimer” product that was likely produced by the forward and reverse primers annealing to one other. In addition, some of the lanes show products that are not expected (*), suggesting that the annealing temperature was not high enough, and the primers were annealing to additional sites outside of the RFP gene. All images of fish are lateral views with anterior to the left. |
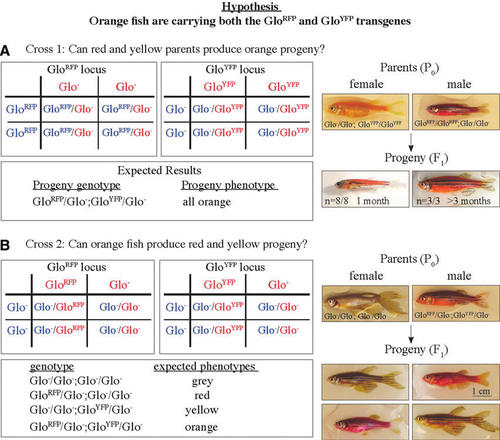
Crosses to determine the origin of the body color of orange GloFish. (A) Punnett square describing the first test cross and images of parental and progeny phenotypes. If the hypothesis was correct, the students expected all of the progeny to have an orange body color, which exactly matched the results of this test cross. (B) Punnett square describing complementary test cross and images of parents and selected progeny. If the hypothesis is correct, the cross should produce red and yellow progeny. Consistent with the hypotheses and the predictions from the Punnett square, yellow (n=5), red (n=2), orange (n=5), and gray (n=1) progeny were produced. All images are lateral views with anterior to the left. |

Patterns of fluorescence are consistent with orange GloFish carrying both the GloRFP and GloYFP transgenes. Progeny from Cross 2 in Figure 2 were assayed for emission of fluorescence after excitation by different wavelengths of light. Each row contains images of the same fish. The first column has images of the whole fish, and the remaining columns have images of the surgically removed caudal fins. The prominent structures are the fin rays (open white arrowheads). The red fish, consistent with the properties of RFP, fluoresces weakly under blue light and strongly under green light. In contrast to the yellow fish, the fluorescence is present in both the fin rays and the mesenchymal tissues in between. The yellow fish, consistent with the known properties of YFP, fluoresces strongly under blue light (480 nm) and only weakly under green light (545 nm). Fluorescence under both wavelengths is largely localized to the fin rays. The orange fish fluoresces strongly when excited by blue and green light, and fluorescence is present in the fin rays and in between. None of the GloFish fluoresce under UV light (350 nm). Analysis of all of the progeny demonstrated that fish with the same color under white, room light also have matching fluorescence patterns (Supplementary Material 7). All images are lateral views with anterior to the left. |
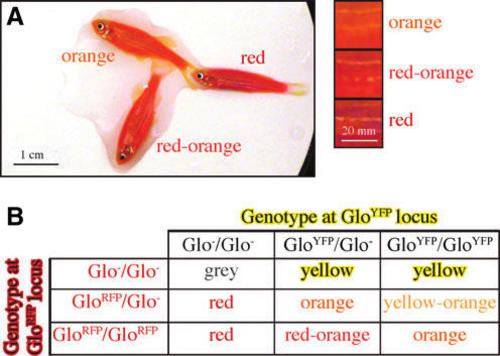
Hypothesis that different dosages of Glo transgene loci affects the shade of color in orange GloFish. (A) Examples of two adult GloFish with different shades of orange and a red GloFish for comparison. The squares to the right are magnifications of similar regions in the trunk of each fish. Fish are homozygous for the golden mutation, which causes lack of pigment in their stripes. (B) Matrix describing the hypothesis about how the genotypes at the GloRFP and GloYFP loci influence the body color of the GloFish. |
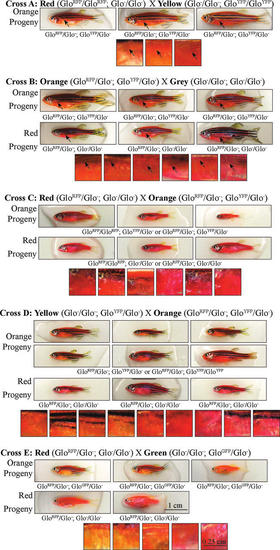
Different shades of orange in developing GloFish with the same genotype. Comparisons between selected red and orange fish resulting from the indicated test crosses. The squares to the right of each group of whole pictures are magnified views of the fish in a region just posterior to the pectoral fin, arranged in the same order as the whole fish pictures. Arrows in the images for Crosses A and B indicate the location of the pectoral fins. Note that there are different shades of orange fish in crosses A and B even though they all have the same complement of transgenes. All images are lateral views with anterior to the left. |

Different colored GloFish have distinct patterns of fluorescence in their caudal fins. GloFish with different body colors under regular room light were assayed for fluorescence emission after excitation by different wavelengths of light. Each row contains images of the same fish. The first column has images of the whole fish, and the remaining columns have images of the surgically removed caudal fin. A range of wavelengths was used to excite the fluorophores, and the peak wavelength is listed above each column. The fins are in lateral views with anterior to the left and dorsal to the top. The same exposure times were used for each fish for each wavelength of light (20 msec for bright field and 400 msec for each of the specific wavelengths of light). The exception to this was fin of the green GloFish, which was extremely bright under blue (480 nm) light, so image at this wavelength was taken with a 200 msec exposure. |
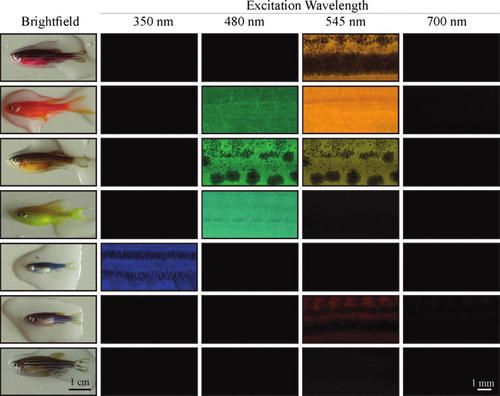
Different colored GloFish have distinct patterns of fluorescence in their trunk. GloFish with different body colors under room light were assayed for fluorescence emission after excitation by different wavelengths of light. A range of wavelengths was used, and the peak wavelength within each range is listed above each column. Each row contains images of the same fish. The first column has images of the whole fish, and the remaining columns have images of the center dorsal region of the trunk of the fish, with the fish positioned in a lateral view with anterior to the left and dorsal to the top. Brighfield images were taken with a 20 msec exposure, images of fish exposed to 350, 480, 545 nm light were taken at 30 msec exposure, and images of fish exposed to 700 nm light were taken at 200 msec exposure. The exception to this was green fish under 480 nm light, which was taken at a 10 msec exposure because the fluorescence was so bright. |