
- Title
-
Decoding the rules of recruitment of excitatory interneurons in the adult zebrafish locomotor network
- Authors
- Ausborn, J., Mahmood, R., and El Manira, A.
- Source
- Full text @ Proc. Natl. Acad. Sci. USA
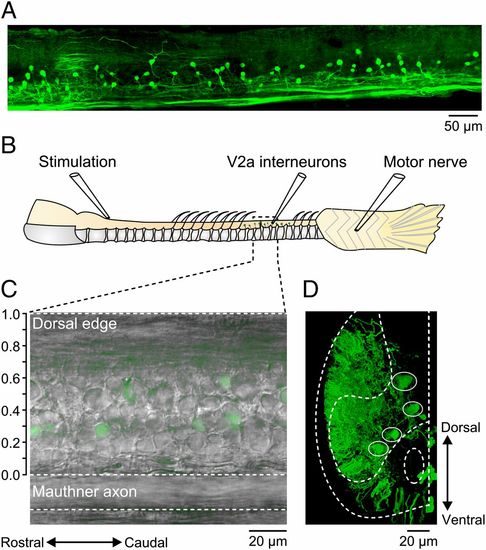
Experimental setup and distribution of V2a interneurons. (A) Lateral view of a reconstructed spinal cord showing the distribution of V2a interneurons along the dorsoventral and rostrocaudal axis. (B) Schematic drawing of the in vitro brainstem/spinal cord preparation. (C) Overlay of DIC and fluorescence images showing V2a interneurons expressing GFP. The vertical scale axis shows how the soma position is measured using the normalized distance between the dorsal edge of the Mauthner axon and the dorsal edge of the spinal cord. (D) Transverse section of the spinal cord showing the dorsoventral and mediolateral distribution of V2a interneurons (circles). Dashed lines mark the spinal cord outline and the position of the Mauthner axon. |