
- Title
-
Using BAC transgenesis in zebrafish to identify regulatory sequences of the amyloid precursor protein gene in humans
- Authors
- Shakes, L.A., Du, H., Wolf, H.M., Hatcher, C., Norford, D.C., Precht, P., Sen, R., and Chatterjee, P.K.
- Source
- Full text @ BMC Genomics
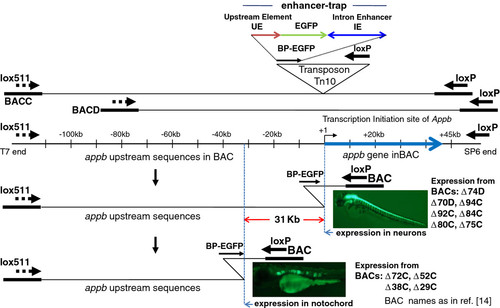
Scanning the appb genomic region of zebrafish by enhancer trapping using BACs represented schematically. The two BACs C and D used in this study overlap one another and contain different lengths of sequences upstream of appb gene. They are shown schematically as the top two lines. The inverted triangle represents enhancer-trap in Tn10 transposon, which is comprised of 0.35 kb of DNA immediately upstream of appb (UE), followed by EGFP gene with basal promoter, and ~1 kb intron 1 enhancer (IE). The entire enhancer-trap cassette is named BP-EGFP. The appb gene region in the BACs, with the thick blue arrow to represent the total length of exons and introns of the gene, is drawn to scale and shown below it. Insertion of the enhancer-trap into the appb BAC DNA and subsequent Cre recombination between the transposed loxP and the BAC-end loxP deletes the BAC DNA from that end and simultaneously inserts the enhancer-trap (shown as BP-EGFP). The enhancer-trap is in front of loxP in the transposon and is retained in the BAC after Cre-mediated loxP-loxP deletion. This end-truncation is represented by the bent line to illustrate the location of that transposon-end retained in the BAC after the loxP-Cre deletion. The earlier study found that appb BACs that had the enhancer-trap located close to the appb transcription start site expressed EGFP fluorescence in neurons (e.g. BACs Δ74D, Δ70D, Δ94C, Δ92C Δ84C, Δ80C, Δ75C), while appb BACs that had the enhancer-trap inserted further upstream beyond -31 kb of the appb gene expressed EGFP fluorescence in the notochord (e.g. BACs Δ72C, Δ52C, Δ38C, Δ29C). The vertical blue dotted lines, separated by ~31 kb, mark these locations on the appb BACs. The names of BACs are indicated adjacent to the pictures of EGFP expression in zebrafish neurons or the notochord. |
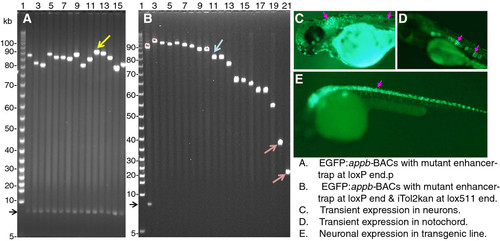
Panel A: FIGE analysis of enhancer-trap BACs with mutated intron 1 enhancer from different libraries. Panel B: FIGE analysis of clone DNA from the library generated by inserting Tnlox511-iTol2kan at the lox511 end of the enhancer-trap BAC in lane 12, Panel A (marked by yellow arrowhead). Panel C: EGFP fluorescence from transient expression in neurons (marked by the pink arrowheads) of zebrafish injected with mutated but functional intron enhancer-trap BAC with intact upstream DNA, Panel D: EGFP expression in notochord (indicated with pink arrowheads) from injecting enhancer trap BAC with mutated but functional intron enhancer and with 31 kb upstream DNA deleted (such as clone in lane 21, panel B, red arrowhead) taken from the same library as the BAC used for Panel C. Panel E: EGFP fluorescence in neurons (marked by the pink arrowhead) from a F2 transgenic zebrafish line obtained from the enhancer-trap BAC shown in lane 11 of Panel B (marked by blue arrowhead). The mutated but functional intron enhancer used was deleted for GATA3, OCT1 and the CT-repeat element (clone shown schematically in row 8, Panel B of Figure 2. Additional examples of germline transgenic fish with slightly smaller enhancer-trap BAC transgenes, but containing the upstream ~31 kb sequence, are shown in Figure 6. panels A and B of reference 23]. The BAC vector DNA band from Not I digestion is shown by the black arrowhead to the left of panels A and B. Lane 2, Panel B, contains the same DNA as lane 12, Panel A. Lanes 3–21 in panel B do not have this band because insertion of Tnlox511-iTol2kan at the lox511 end of BAC DNA and subsequent lox511-lox511 deletion eliminates the Not I site at that end |