
- Title
-
Activity-induced long-term potentiation of excitatory synapses in developing zebrafish retina in vivo
- Authors
- Wei, H.P., Yao, Y.Y., Zhang, R.W., Zhao, X.F., and Du, J.L.
- Source
- Full text @ Neuron
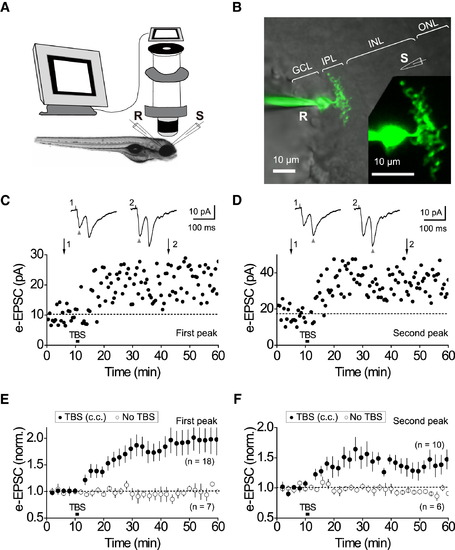
Induction of LTP at BC-RGC Synapses by TBS(A) Diagram of the experimental setup, depicting in vivo perforated whole-cell recording in zebrafish larva retina, is illustrated. R, recording electrode; S, extracellular stimulation electrode.(B) A bright-field image showing the retinal structure of a 4 dpf zebrafish larva is presented. The inset shows the morphology of a RGC, which was filled with lucifer yellow after recording. The dendrites of the RGC ramify in the proximal part (sublamina b) of the IPL. An extracellular stimulation electrode (“S”) was placed near the soma of BCs in the INL. GCL, ganglion cell layer; ONL, outer nuclear layer.(C and D) An example of changes in the amplitude of the first (C) and second (D) peaks in RGC e-EPSCs (at 60mV) following TBS, with the RGC held in c.c., is shown. Sample e-EPSCs are averages of 20 events around the time marked by the numbered arrows. The data shown in (C) and (D) were obtained from the same RGC. The gray arrowheads mark the first (C) and second (D) peaks of e-EPSCs analyzed, respectively.(E and F) Summary of changes in the amplitude of the first (E) and second (F) peaks in RGC e-EPSCs (at 60mV) following TBS (filled circles) or in absence of TBS (open circles), is shown. The data were normalized (norm.) by the mean value (dotted line) observed before TBS. The number in the brackets indicates the number of RGCs examined. Error bars, ± SEM.See also Figures S1 and S2. |
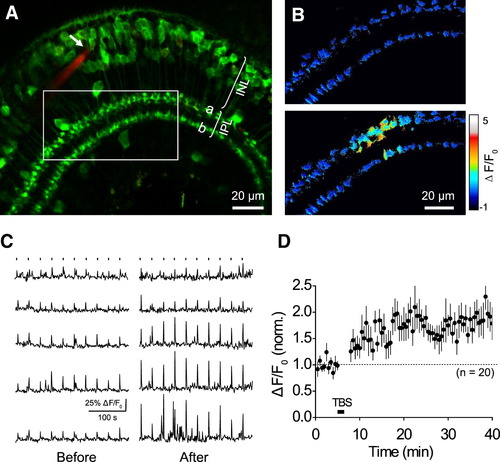
TBS Induces a Persistent Increase in Ca2+ Responses of BC Axon Terminals(A) In vivo two-photon fluorescence optical section through the retina of a 4 dpf Tg(Gal4-VP16xfz43,UAS:GCaMP1.6) larva, in which GCaMP1.6 is specifically expressed in some BCs (green), is demonstrated. The soma of GFP-expressing BCs preferentially locates in the distal part of INL, and its axon terminals are at both the sublaminae a and b of IPL. Red indicates the tip of the stimulating electrode (white arrow) loaded with dextran. The calcium responses of BC axon terminals in the region indicated by the white rectangle are shown in (B).(B) Calcium responses of BC axon terminals immediately before (top) and after (bottom) an electrical stimulus, are presented. Pseudocolor images using scale of fractional change in fluorescence intensity relative to average baseline levels are shown.(C) Electrically evoked calcium responses of all five responsive BC axon terminals from a single retina 0–5 min before and 25–30 min after TBS application, are shown. The small black bars (top) indicate electrical stimuli.(D) Summary of data showing that TBS induces a persistent increase in the amplitude of calcium responses in BC axon terminals, is demonstrated. Data were obtained from all 20 responsive BC axon terminals from 4 different retinae. Error bars, ± SEM.See also Figures S2 and S4. |