
Fig. 14
- ID
- ZDB-IMAGE-091217-9
- Publication
- Parichy et al., 2009 - Normal table of postembryonic zebrafish development: Staging by externally visible anatomy of the living fish
- All Figures
- Figures for Parichy et al., 2009
|
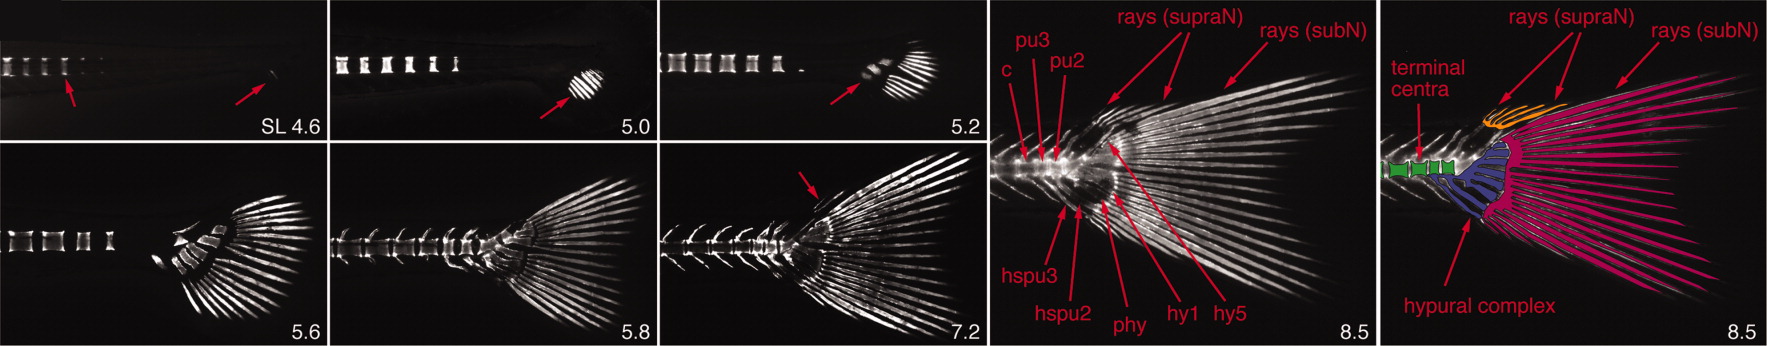
Fig. 14 Ossification progress of caudal complex revealed by calcein staining. Shown are multiple individuals (standard length [SL] in lower right of each panel). Annotations for arrows are provided left to right for each panel; overlays are units scored in Figure 15. 4.6, posteriormost ossified centrum, first ossifying ray segment; 5.0, first segments of multiple ossified fin rays; 5.2, hypurals; 7.2, supranotochordal fin rays; 8.5, c = centra, pu = preural, hspu = hemal spines from preural, phy = parahypural, hy = hypural, green overlay = terminal centra complex [6 posterior centra and both preural (pu) 2 and 3 of the vertebral column]; blue overlay = hypural complex [hypurals (hy) 1-5, parahypural (phy), and the hemal spines (hspu) originating from pu2 and pu3], orange overlay = supranotochordal rays [dorsal procurrent rays appearing dorsal to the notochord], pink overlay = subnotochordal rays [including the principal caudal rays of the dorsal and ventral lobes and the ventral procurrent rays that are supported by hspu2, hspu3, and phy]. Terminal centra counts (shown in Fig. 20) are best performed posterior-to-anterior with hspu2 and hspu3 serving as landmarks for their corresponding centra; staining for these hemal spines occurs before staining of centra. At earlier stages, the terminal somite boundaries can be used to identify segments corresponding to pu2 and pu3.