
- Title
-
Single-Cell Reconstruction of Emerging Population Activity in an Entire Developing Circuit
- Authors
- Wan, Y., Wei, Z., Looger, L.L., Koyama, M., Druckmann, S., Keller, P.J.
- Source
- Full text @ Cell
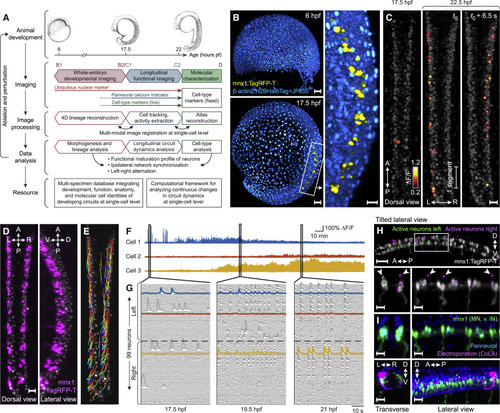
Imaging and Data Analysis Framework for Reconstructing Development and Functional Maturation of the Embryonic Spinal Cord at the Single-Cell Level (A) Experimental paradigm and computational workflow for combined whole-embryo developmental imaging and longitudinal functional imaging of developing zebrafish spinal cord. (B) Lateral-view snapshots of developmental imaging data. Blue: ubiquitous reporter, yellow: MNs and ventral INs. (C) Dorsal-view snapshots of functional imaging data of embryonic spinal cord. Gray: GCaMP6f baseline. (D) Dorsal- and lateral-view snapshots of mnx1 expression pattern at 22 hpf. Gray: GCaMP6f baseline. (E) Curated cell tracks of active neurons in spinal cord over 4.5 h of functional imaging. Time color-coded red to blue. (F) Example traces of long-term activity in single neurons. (G) Single-neuron activity traces of all active neurons in spinal circuit within field of view at 17.5, 19.5, and 21 hpf. Neuron order is preserved across time windows and examples from (F) are highlighted. (H) Cell-type identification of active neurons. Top: locations of active neurons on left (green) and right (magenta) sides of spinal cord, overlaid with mnx1 channel (gray). Bottom: enlarged view of boxed region (left: cross-section, right: side view). Arrows indicate soma locations of mnx– active neurons on dorsal side. (I) Characterization of mnx+ and mnx– cell morphologies. Top: elavl3 (blue) and mnx1 (green) expression at 24 hpf. Bottom: labeling of active mnx– neuron by electroporation (magenta, contralateral and ascending projection to hindbrain, imaged at 2 dpf). Magenta channel is gamma-corrected to visualize thin processes. Cross-section (left) and side view (right) are shown. Hours pf (or hpf), hours post-fertilization; A, anterior; P, posterior; L, left; R, right; D, dorsal; V, ventral. Scale bars: 50 μm (B, left; H, top) and 20 μm (B, right; C; D; H, bottom; I). See Videos S1, S2A, S3, and S4 and Figure S1. |
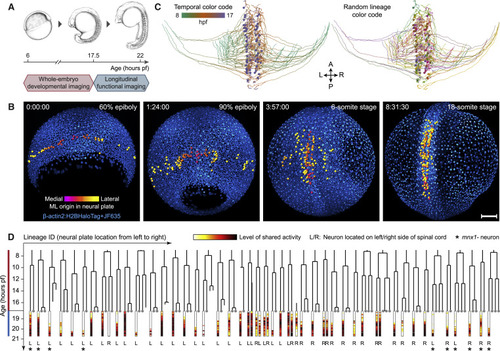
Long-Term Imaging of Whole-Circuit Development and Function Enables Comprehensive Reconstruction of Neuron Lineages and Activity Profiles (A) Timeline of combined developmental and functional imaging of spinal cord development. (B) Maximum-intensity projections of whole-embryo developmental imaging data at four time points. Colored spheres show tracked precursors of spinal neurons that are active by 22 hpf. The cell-type-specific marker (mnx) is not shown. Time stamps (h:min:s): imaging time. (C) Dorsal view of reconstructed tracks of all active neurons in spinal circuit. Colors: time (left) or random colors for lineages (right). (D) Lineage tree and activity profiles of all active neurons for data shown in (C). Horizontal order in tree determined by medio-lateral cell position in neural plate is shown. For neurons involved in patterned activity, fraction of activity variance explained by shared factors is shown below tree. Gray dots at end of branches mark siblings that are not active neurons. Scale bars: 100 μm (B). See Video S1 and Figure S7. |
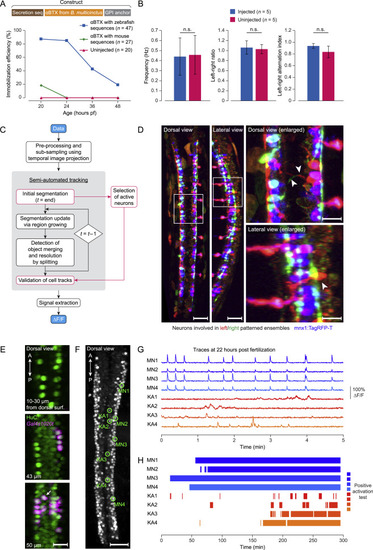
Immobilization of Embryos, Processing of Longitudinal Functional Imaging Data, and Identification and Characterization of KA Neurons in the Developing Spinal Cord, Related to Figure 1 and STAR Methods (A) Comparison of immobilization efficiency for embryos injected at the 1-cell stage with 50 ng/μl mRNA of alpha-bungarotoxin (αBTX) with zebrafish membrane-tethering sequences (blue), 50 ng/μl mRNA αBTX with mouse membrane-tethering sequences (red), and for uninjected siblings (orange) at 20, 24, 36 and 48 hpf. Membrane-tethered αBTX effectively immobilizes over 80% of the injected embryos until 24 hpf. Efficiency is shown as the percentage of embryos that do not react to dechorionation at 20 hpf or touch response at 24, 36 and 48 hpf. (B) Comparison of parameters characterizing the activity patterns underlying real and fictive coiling behavior in non-immobilized embryos and in embryos injected with 50 ng/μl mRNA of membrane-tethered alpha-bungarotoxin at 22-24 hpf. No significant difference (Wilcoxon rank-sum test, p > 0.1) was observed in behavior frequency (left panel), ratio of left versus right patterns (middle panel) or left-right alternation index (right panel). The alternation index is defined as the number of consecutive pairs of patterned events occurring on opposite sides of the spinal cord, divided by the total number of events minus one, over a 10 min recording time period. (C) Flowchart of the semi-automated cell tracking pipeline for functional image data (see STAR Methods for details). First, raw images are pre-processed and subdivided into groups of 200 time points. For each group, a single image stack is computed by maximum-intensity projection along the time axis. Second, the resulting stacks are input into an automatic tracking algorithm, which comprises initialization, update and merge detection/split steps. In parallel, active neurons are identified and selected based on the last 20 min of the time-lapse recording. Subsequently, tracks of the selected active neurons are validated by manual curation. Finally, the locations of the tracked cells are interpolated across the full time series and the calcium signal for each cell is extracted from the images as a function of time to calculate ΔF/F. Procedures in black boxes are performed by automated algorithms, steps in orange boxes are interactively integrated with a manual curation workflow using the Fiji plugins MTrackJ and MaMuT. (D) Identification of morphology and types of neurons involved in patterned activity. Active neurons involved in patterned activity on the left (green) and right (magenta) side of the spinal cord were identified and their morphologies visualized by voxel-based independent component analysis (ICA) of volumetric functional image data of a pan-neuronally expressed cytosolic calcium indicator (elavl3:GCaMP6f). The ICA results are furthermore superimposed with the cell-type specific marker mnx1:TagRFP-T (blue) that labels MNs and VeLD INs. The morphologies of the corresponding neuron populations are visualized here using maximum-intensity projections showing dorsal and lateral views of the spinal cord (left), together with enlarged views of the regions highlighted by white boxes on the right. White arrows in the dorsal-view image indicate the commissural projections of mnx- INs, and the white arrow in the lateral-view image indicates the location of an mnx- neuron cell body located in the dorsal spinal cord. Scale bars, 50 μm (left and middle) and 20 μm (right). (E) Dorsal-view images of an embryo from a cross of the transgenic lines Tg(elavl3:H2B-GCaMP6f) and Tg(Gal4s1020t)Tg(UASmCherry) at different depths along the dorso-ventral axis. The pan-neuronal expression pattern of elavl3:H2BGCaMP6f (green) covers all cells, including KA neurons (example indicated by white arrow), labeled by the transgenic line Tg(Gal4s1020t)Tg(UASmCherry) (magenta). Scale bar, 20 μm. (F) Identification of KA neurons and representative MNsduring longitudinal functional imaging of elavl3:H2B-GCaMP6f. A dorsal view of the spinal cord is shown as a maximum-intensity projection of the image volume at 22 hpf, with four KA neurons and four MNs highlighted by green circles. Scale bar, 50 μm. (G) Calcium traces of the four KA neurons and four MNs highlighted in panel (F) at 22 hpf. Notably, the activity of KA neurons is not synchronized or in phase with the rhythmic motor patterns. (H) Activity classification of the four KA neurons and four MNs highlighted in panel (F) during spinal circuit development. KA neurons become active later than the earliest active MNs. |
Reprinted from Cell, 179(2), Wan, Y., Wei, Z., Looger, L.L., Koyama, M., Druckmann, S., Keller, P.J., Single-Cell Reconstruction of Emerging Population Activity in an Entire Developing Circuit, 355-372.e23, Copyright (2019) with permission from Elsevier. Full text @ Cell