
Figure 5
- ID
- ZDB-IMAGE-261014-658
- Publication
- Ahmed et al., 2026 - TNFα-dependent modulation of WT1-MMP9 regulatory axis links developmental and inflammatory pathways in glaucoma
- All Figures
- Figures for Ahmed et al., 2026
|
Figure 5
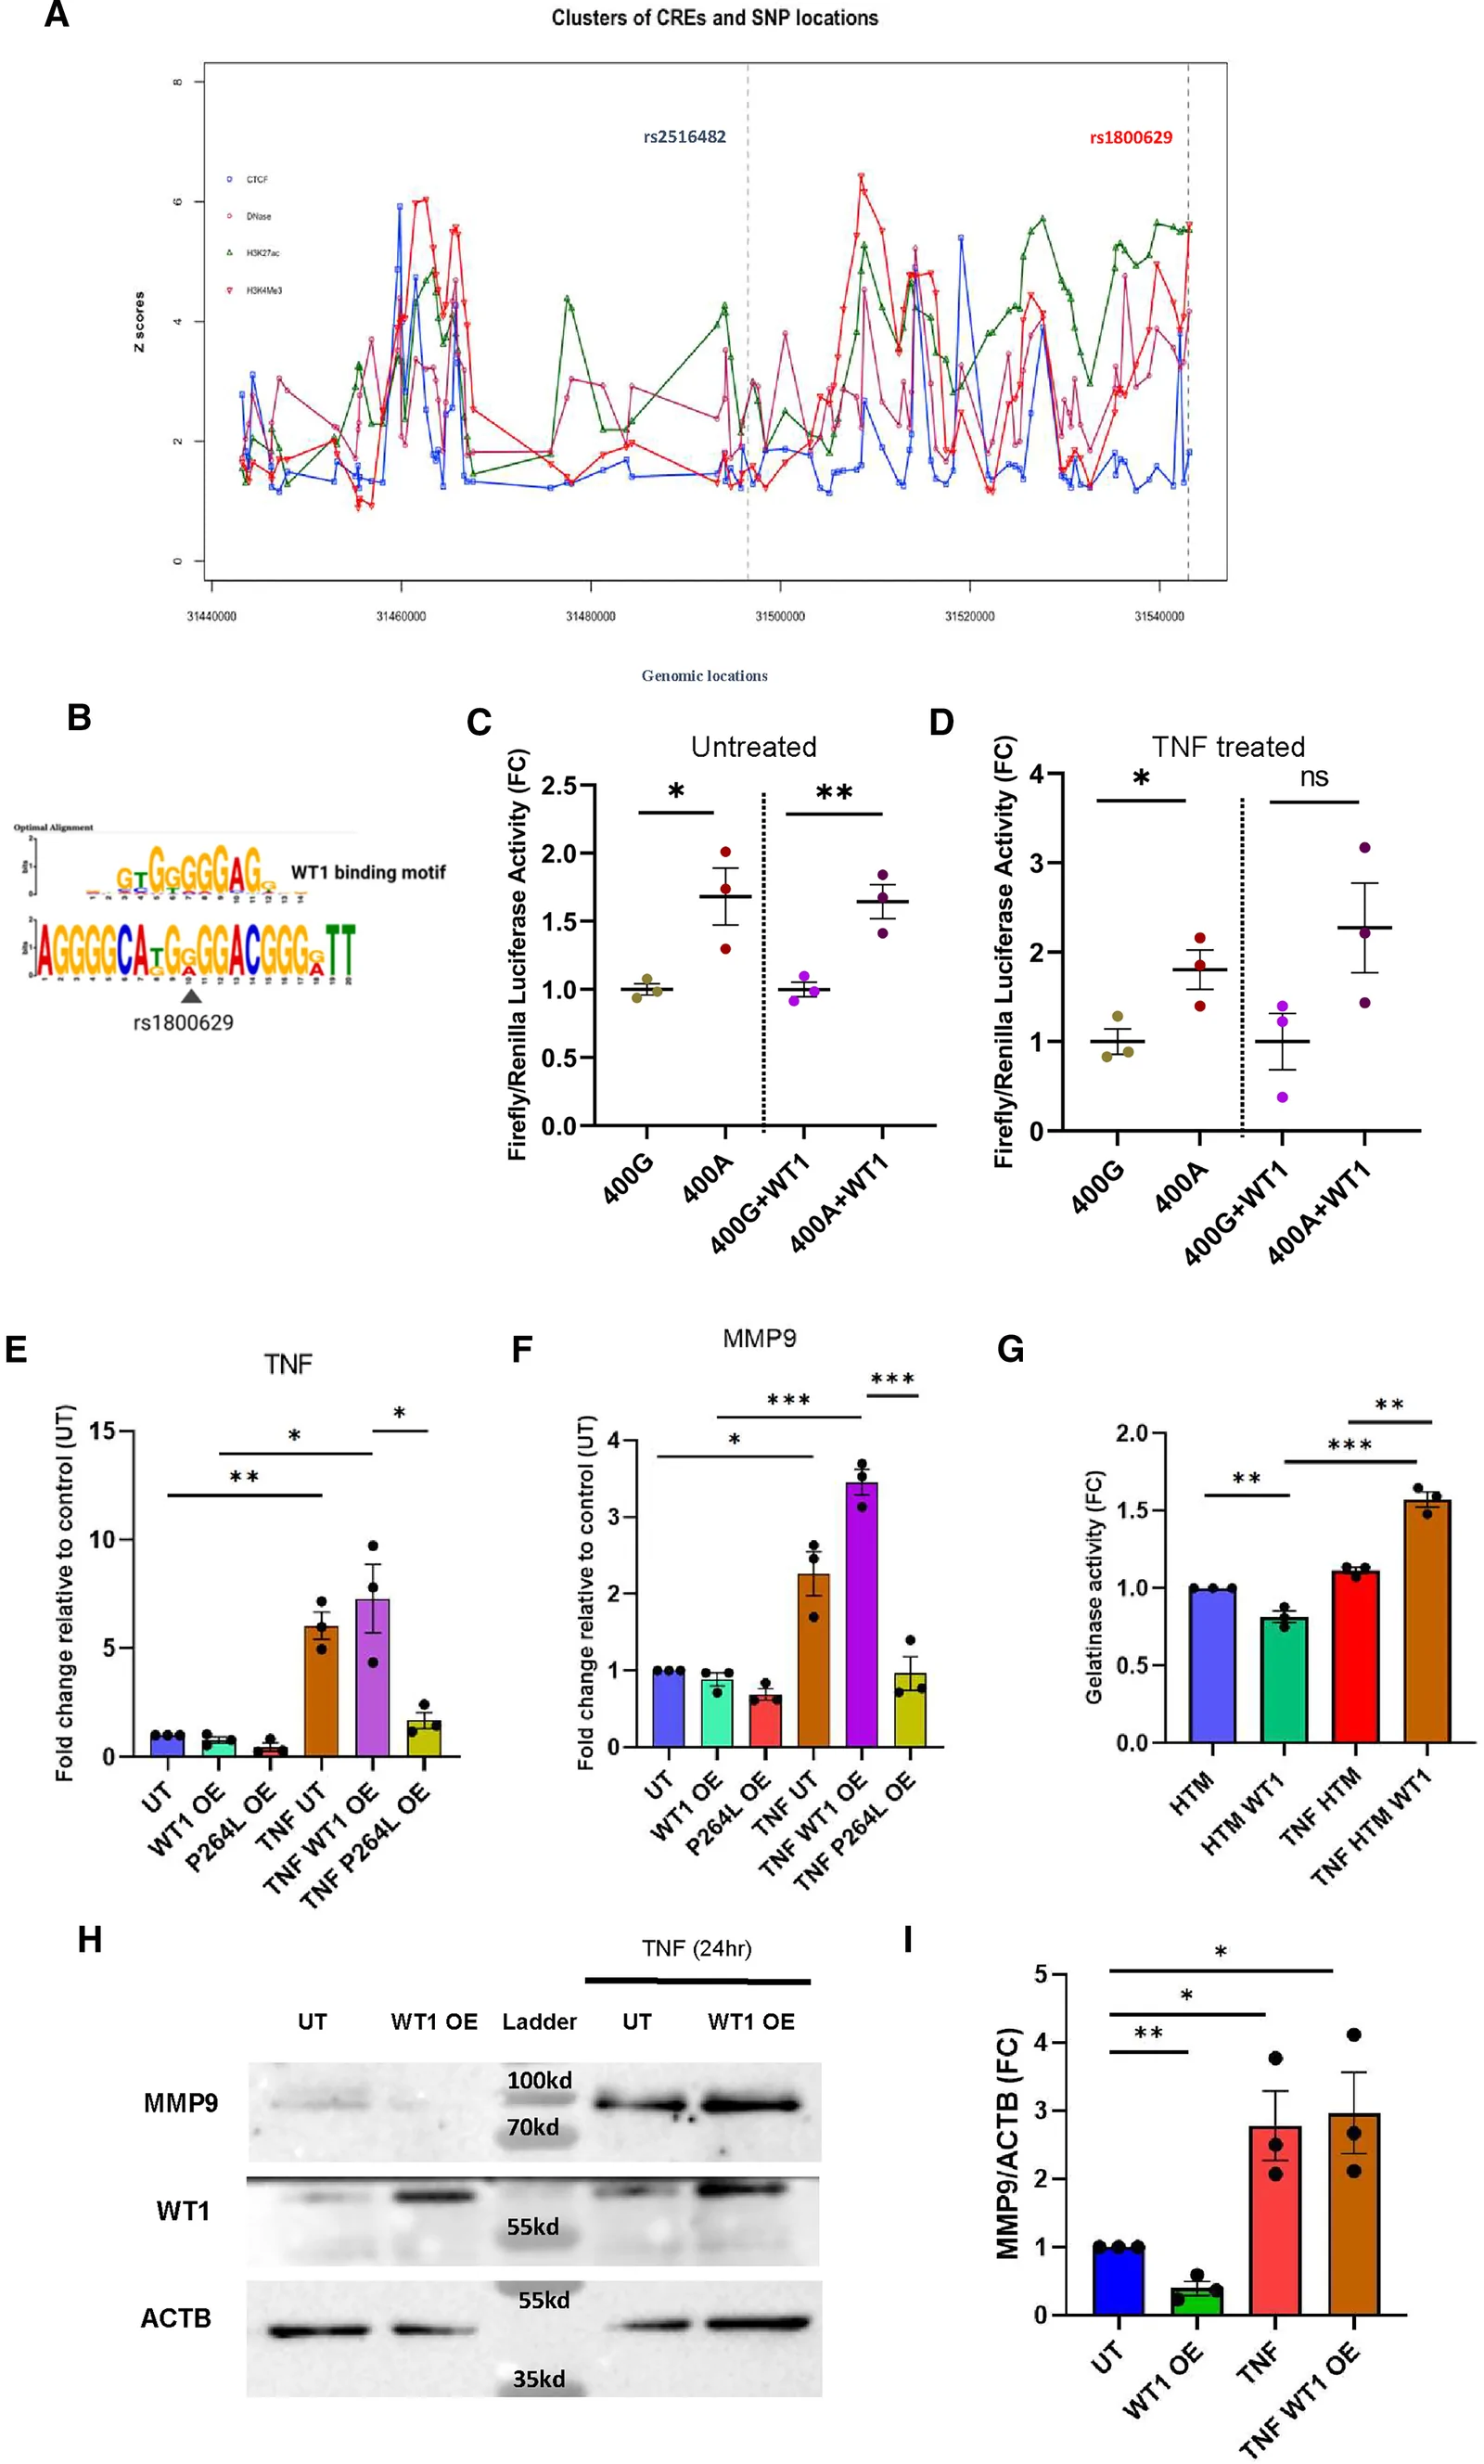
WT1 and TNF-α functionally interact to regulate MMP9
(A) Summary of epigenomic signatures of TNF-α promoter region showing the positions of rs1800629 and rs2516482.
(B) rs1800629 lies in WT1 binding motif in the TNF-α promoter. Allele-specific luciferase activity of TNF-α promoter under.
(C) No treatment and (D) TNF-α treated conditions. Each data point represents relative luciferase activity in fold change from one independent biological replicate; N = 3; error bars show mean ± SEM; ∗p < 0.05, ∗∗p < 0.01, ∗∗∗p < 0.001 and ∗∗∗∗p < 0.0001. Relative gene expression levels of (E) TNF-α and (F) MMP9 under wild type WT1 and P264L mutant WT1 overexpression and TNF-α treatment combination conditions. Individual data points represent relative expression in fold change from one biological replicate; N = 3.
(G) Gelatinase activity of MMP9 upon WT1 overexpressed (HTM WT1), TNF-α treated and combination (TNF HTM WT1) conditions. Data points represent average gelatinase activity in fold change from independent biological replicates; N = 3.
(H) Immunoblot of MMP9 with WT1 overexpressed (WT1 OE), TNF treated and combination (TNF WT1 OE) conditions.
(I) Densitometric analysis of MMP9 intensity; Individual data points represent relative expression in fold change from one biological replicate; N = 3; error bars represent mean ± SEM. Unpaired t test is performed to assess statistical significance; ∗p < 0.05, ∗∗p < 0.01, ∗∗∗p < 0.001 and ∗∗∗∗p < 0.0001.