
Fig. 1
- ID
- ZDB-IMAGE-260805-105
- Genes
- Publication
- Yi et al., 2026 - HUWE1 targets mitochondria via RMC1 to promote neurodevelopment
- All Figures
- Figures for Yi et al., 2026
|
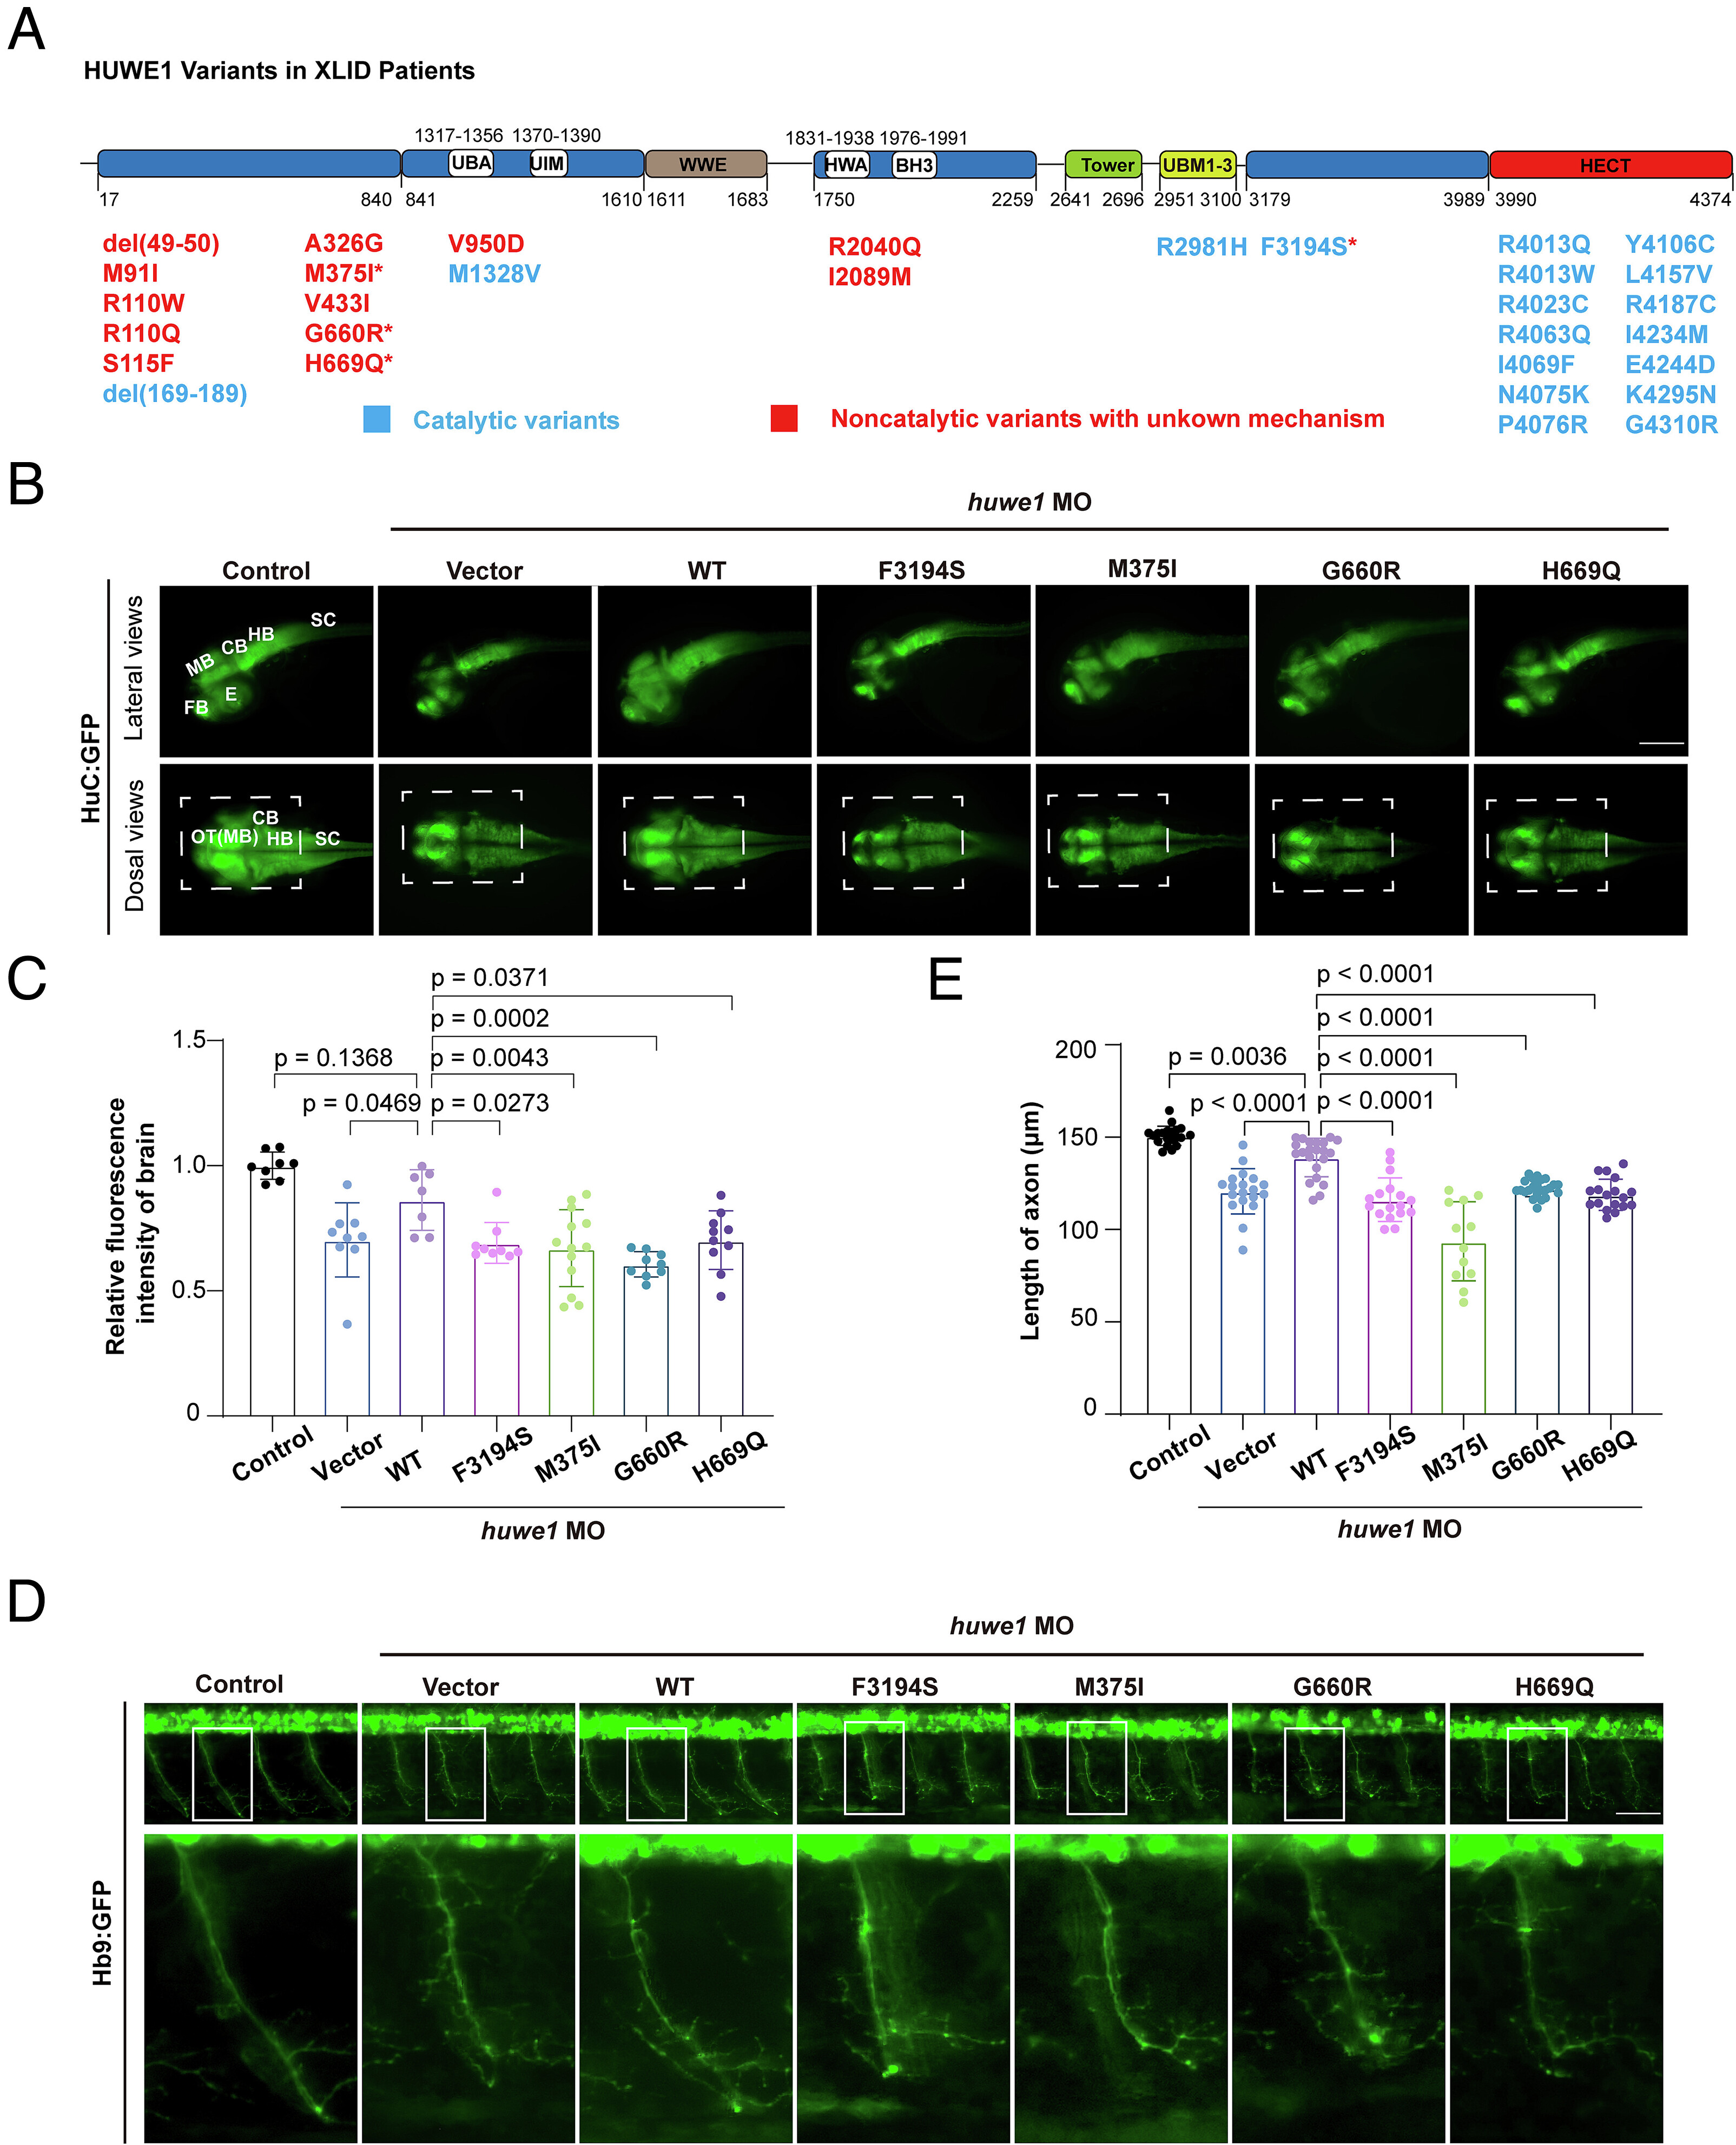
Fig. 1 Noncatalytic HUWE1 variants associated with XLID impair neural development in zebrafish. (A) Schematic representation of human HUWE1 showing amino acid substitutions caused by XLID-associated variants. These variants are distributed throughout the HUWE1 protein and fall into two categories: noncatalytic variants (red) and catalytic variants (blue). The four variants (M375I, G660R, H669Q, and F3194S) analyzed in this study are marked with red asterisks. UBA: ubiquitin-associated domain; UIM: ubiquitin-interacting motif; WWE: tryptophan–tryptophan–glutamate sequence motif; HWA: HUWE1 WWE module associated domain; BH3: BCL-2 homology domain 3; UBM1-3: UB module 1, UB module 2, and UB module 3; HECT: homologous to E6-AP carboxyl terminus. (B) Representative fluorescence images showing HuC-GFP signals in Tg (HuC: GFP) zebrafish embryos at 48 h postfertilization (hpf). Images are displayed as maximum-intensity projections of z-stacks. Anatomical regions are indicated as follows: FB, forebrain; MB, midbrain; OT, optic tectum; CB, cerebellum; HB, hindbrain; SC, spinal cord; E, eye. Lateral views are shown on the top, and dorsal views are shown on the bottom. (Scale bar, 200 μm.) (C) Quantification of HuC-GFP fluorescence intensity in the zebrafish brain at 48 hpf. HuC-GFP intensity was measured within the indicated brain region of interest marked by the white box in the dorsal-view images. Values were normalized to the mean fluorescence intensity of the Control group, which was set to 1. Each group included 7 to 13 embryos. Control embryos were injected with control morpholino (MO) (n = 8 embryos). The huwe1 MO + Vector group received huwe1 MO together with control vector plasmids (n = 9 embryos). For rescue experiments, huwe1 MO was coinjected with plasmids expressing human HUWE1 WT (n = 7 embryos), HUWE1 F3194S (n = 9 embryos), HUWE1 M375I (n = 13 embryos), HUWE1 G660R (n = 9 embryos), or HUWE1 H669Q (n = 10 embryos). (D) Representative images of CaP motor axons in Tg (Hb9:GFP) ml2 zebrafish embryos at 48 hpf acquired by maximum-intensity projections of z-stacks. Upper panels show lateral views, and Lower panels show enlarged images of the boxed regions. (Scale bar, 100 μm.) (E) Quantification of CaP axon length in 48 hpf zebrafish embryos. For each embryo, three CaP axons located approximately between the third and fifth CaP positions along the yolk extension were measured, and each data point represents the mean axon length from one embryo. The number of embryos analyzed in each group was as follows: control MO, n = 20 embryos; huwe1 MO + Vector, n = 19 embryos; huwe1 MO + HUWE1 WT, n = 22 embryos; huwe1 MO + HUWE1 F3194S, n = 17 embryos; huwe1 MO + HUWE1 M375I, n = 12 embryos; huwe1 MO + HUWE1 G660R, n = 23 embryos; huwe1 MO + HUWE1 H669Q, n = 18 embryos. All morpholinos and plasmids were injected at the one-cell stage. Data are shown as mean ± SD. Statistical significance was determined by one-way ANOVA followed by multiple-comparison analysis in (C) and (E).