
Fig. 7
- ID
- ZDB-IMAGE-260731-35
- Publication
- Li et al., 2026 - The accumulation of methylglyoxal and acrolein impairs arginine homeostasis causing hyperglycemia and renal abnormalities in male zebrafish
- All Figures
- Figures for Li et al., 2026
|
Fig. 7
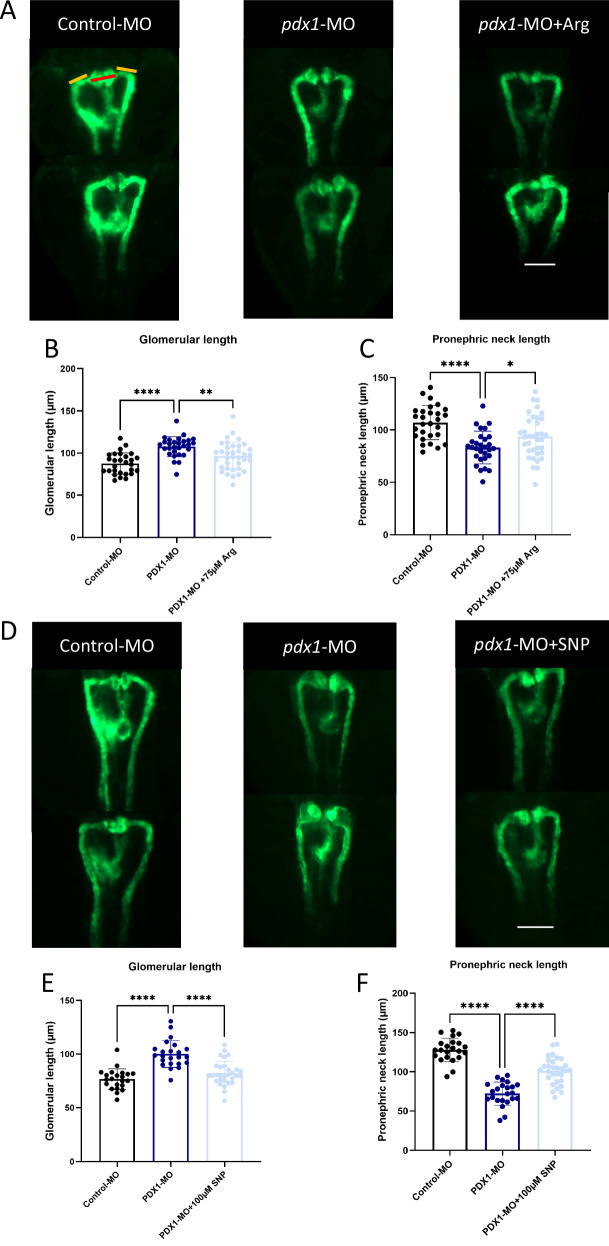
Arginine supplementation rescued pdx1 morpholino-induced hyperglycemic pronephros alterations.
A Representative confocal images of the pronephros morphology in control and pdx1 morphants Tg(wt1b:EGFP) zebrafish larvae at 48 hpf, with or without arginine supplementation. Red line indicates glomerular length, yellow line indicates pronephric neck length. White scale bar = 100 µm. hpf, hours of post fertilization; MO; morphants; pdx1, pancreatic and duodenal homeobox 1. B Quantification of glomerular length in larvae showed a significant increase in pdx1 morphants, which is reduced by arginine supplementation, compared to control group. n = 28/36 biological replicates per group. Exact p values for each comparation are: PDX1-MO vs. Control-MO, p < 0.0001; PDX1-MO vs. PDX1-MO + 75 µM Arg, p = 0.0039. Arg, L-arginine. C Quantification of pronephric neck length in larvae showed a significant decrease in pdx1 morphants, which is restored by arginine supplementation, compared to control group. n = 28/36 biological replicates per group. Exact p values for each comparation are: PDX1-MO vs. Control-MO, p < 0.0001; PDX1-MO vs. PDX1-MO + 75 µM Arg, p = 0.0439. D Representative confocal images of the pronephros morphology in control and pdx1 morphants Tg(wt1b:EGFP) zebrafish larvae at 48 hpf, with or without SNP supplementation. White scale bar = 100 µm. SNP, sodium nitroprusside. E Quantification of glomerular length in larvae showed a significant increase in pdx1 morphants, which is reduced by SNP supplementation, compared to control group. n = 22/30 biological replicates per group. Exact p values for each comparation are: PDX1-MO vs. Control-MO, p < 0.0001; PDX1-MO vs. PDX1-MO + 100 µM SNP p < 0.0001. F Quantification of pronephric neck length in larvae showed a significant decrease in pdx1 morphants, which is restored by SNP supplementation, compared to control group. n = 22/30 biological replicates per group. Exact p values for each comparation are: PDX1-MO vs. Control-MO, p < 0.0001; PDX1-MO vs. PDX1-MO + 100 µM SNP, p < 0.0001. The bars indicate mean ± SD values. Statistical analysis was performed by one-way ANOVA. *p < 0.05, **p < 0.01, ****p < 0.0001. Source data are provided as a Source Data file.