
Fig. 6
- ID
- ZDB-IMAGE-260723-19
- Genes
- Publication
- Kaveh et al., 2026 - Flow-mediated endothelial remodeling and inflammation drive developmental vascular susceptibility in ldlr loss of function
- All Figures
- Figures for Kaveh et al., 2026
|
Fig. 6
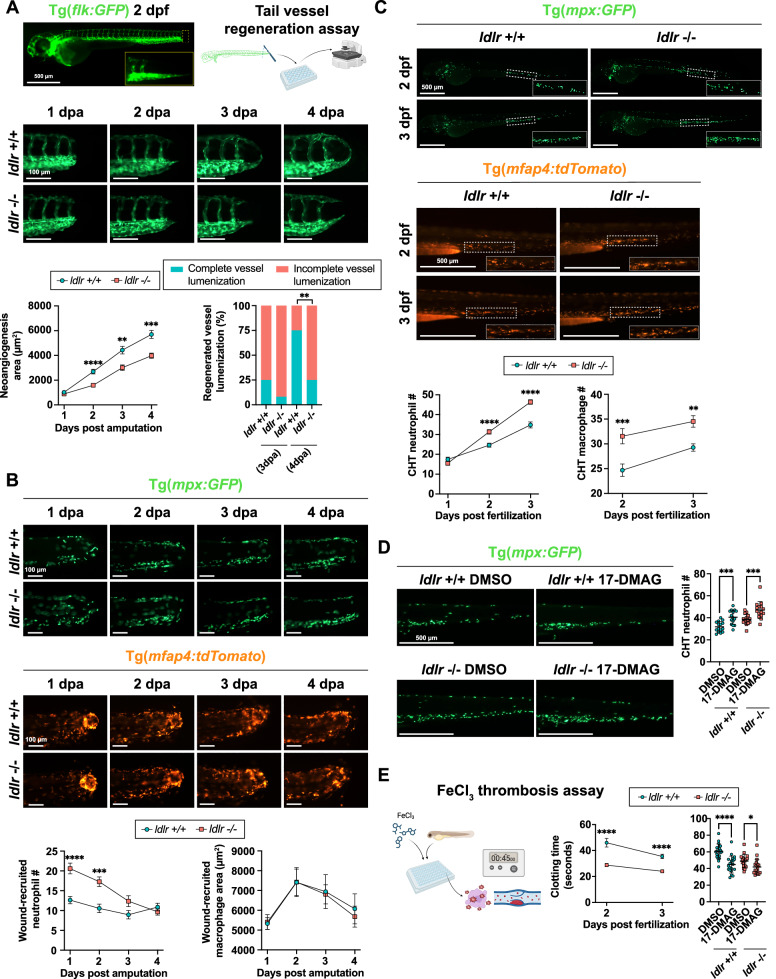
Ldlr-/- zebrafish display reduced regenerative angiogenesis, enhanced innate immune cell expansion and increased thrombogenicity during development.
A Epifluorescence microscopy of Tg(flk:GFP) zebrafish at 2 dpf following tail vessel amputation. Inset shows the two most posterior intersegmental vessels resected (top, left). Schematic of tail vessel regeneration assay. Created in BioRender. Kaveh, A. (2026) https://BioRender.com/gh8cub2 (top, right). Tail vessel repair/regeneration in ldlr + /+ and ldlr-/- zebrafish from 1–4 days post amputation (dpa, middle). Quantification of neoangiogenesis area (μm2) in ldlr + /+ (n = 23-24) and ldlr-/- (n = 22-24) zebrafish at 1 dpa (p = 0.4308), 2 dpa (p < 0.0001), 3 dpa (p = 0.0011), 4 dpa (p = 0.0002); 4 independent experiments. Data are mean ± s.e.m. Two-way ANOVA and Holm-Sidak’s multiple comparison test used (bottom, left). Regenerated vessel lumenization (% with patent blood flow) in ldlr + /+ and ldlr-/- zebrafish at 3 dpa (p = 0.2448) and 4 dpa (p = 0.0012). Fisher’s exact (two-sided) test was (bottom, right). B Epifluorescence microscopy of neutrophil (Tg(mpx:GFP), top) and macrophage (Tg(mfap4:tdTomato), middle) wound recruitment during tail vessel repair/regeneration in ldlr + /+ and ldlr-/- zebrafish from 1–4 dpa. Wound-recruited neutrophil numbers (bottom, left) and macrophage area (μm2, bottom right) in ldlr + /+ (n = 18–20) and ldlr-/- (n = 17–20) zebrafish at 1 dpa (neutrophil: p < 0.0001 and macrophage: p = 0.9998), 2 dpa (neutrophil: p = 0.0006 and macrophage: p > 0.9999), 3 dpa (neutrophil: p = 0.1111 and macrophage: p = 0.9998), 4 dpa (neutrophil: p = 0.3521 and macrophage: p = 0.9998); 3 independent experiments. Data are mean ± s.e.m. Two-way ANOVA and Holm-Sidak’s multiple comparison test used. (C) Epifluorescence microscopy of neutrophils (top) and macrophages (middle) in the caudal hematopoietic tissue (CHT, inset indicates the CHT) of zebrafish at 2 dpf and 3 dpf. CHT neutrophil numbers in ldlr + /+ (n = 21–29) and ldlr-/- (n = 21–30) zebrafish at 1 dpf (p = 0.2090), 2 dpf (p < 0.0001) and 3 dpf (p < 0.0001); 3 independent experiments (bottom, left). CHT macrophage numbers in ldlr + /+ (n = 13–15) and ldlr-/- (n = 13–15) zebrafish at 2 dpf (p = 0.0005) and 3 dpf (p = 0.0020); 2 independent experiments (bottom, right). Data are mean ± s.e.m. Two-way ANOVA and Holm-Sidak’s multiple comparison test used. (D) Epifluorescence microscopy of CHT neutrophils in ldlr + / + and ldlr-/- zebrafish following treatment with 50 μM 17-DMAG or DMSO (left). CHT neutrophil numbers in zebrafish treated with 50 μM 17-DMAG (n = 15) or DMSO (n = 15). Ldlr + /+ DMSO vs ldlr + / + 17-DMAG (p = 0.0005) and ldlr-/- DMSO vs ldlr-/- 17-DMAG (p = 0.0005); 3 independent experiments. Data are mean ± s.d. One-way ANOVA and Holm-Sidak’s multiple comparison used(right). (E) Schematic of FeCl3 thrombosis assay workflow. Created in BioRender. Kaveh, A. (2026) https://BioRender.com/zgdmudi (left). Time to thrombosis (clotting time, seconds) following FeCl3 exposure in ldlr + /+ (n = 22-28) and ldlr-/- (n = 22–29) zebrafish at 2 dpf (p < 0.0001) and 3 dpf (p < 0.0001); 3 independent experiments. Data are mean ± s.e.m. One-way ANOVA and Holm-Sidak’s multiple comparison test used (middle). Thrombosis time in ldlr + / + and ldlr-/- zebrafish treated with 50 μM 17-DMAG (n = 18–20) or DMSO (n = 19–20). Ldlr + /+ DMSO vs ldlr + / + 17-DMAG (p < 0.0001) and ldlr-/- DMSO vs ldlr-/− 17-DMAG (p = 0.0246); 3 independent experiments. Data are mean ± s.d. One-way ANOVA and Holm-Sidak’s multiple comparison used (right). Source data are provided as a Source Data file.