
Figure 5
- ID
- ZDB-IMAGE-260722-6
- Publication
- Roussange et al., 2026 - Integrative analysis of drug-gene signatures in human pluripotent stem cells reveals prazosin as a novel SQSTM1 regulator for ALS therapeutics
- All Figures
- Figures for Roussange et al., 2026
|
Figure 5
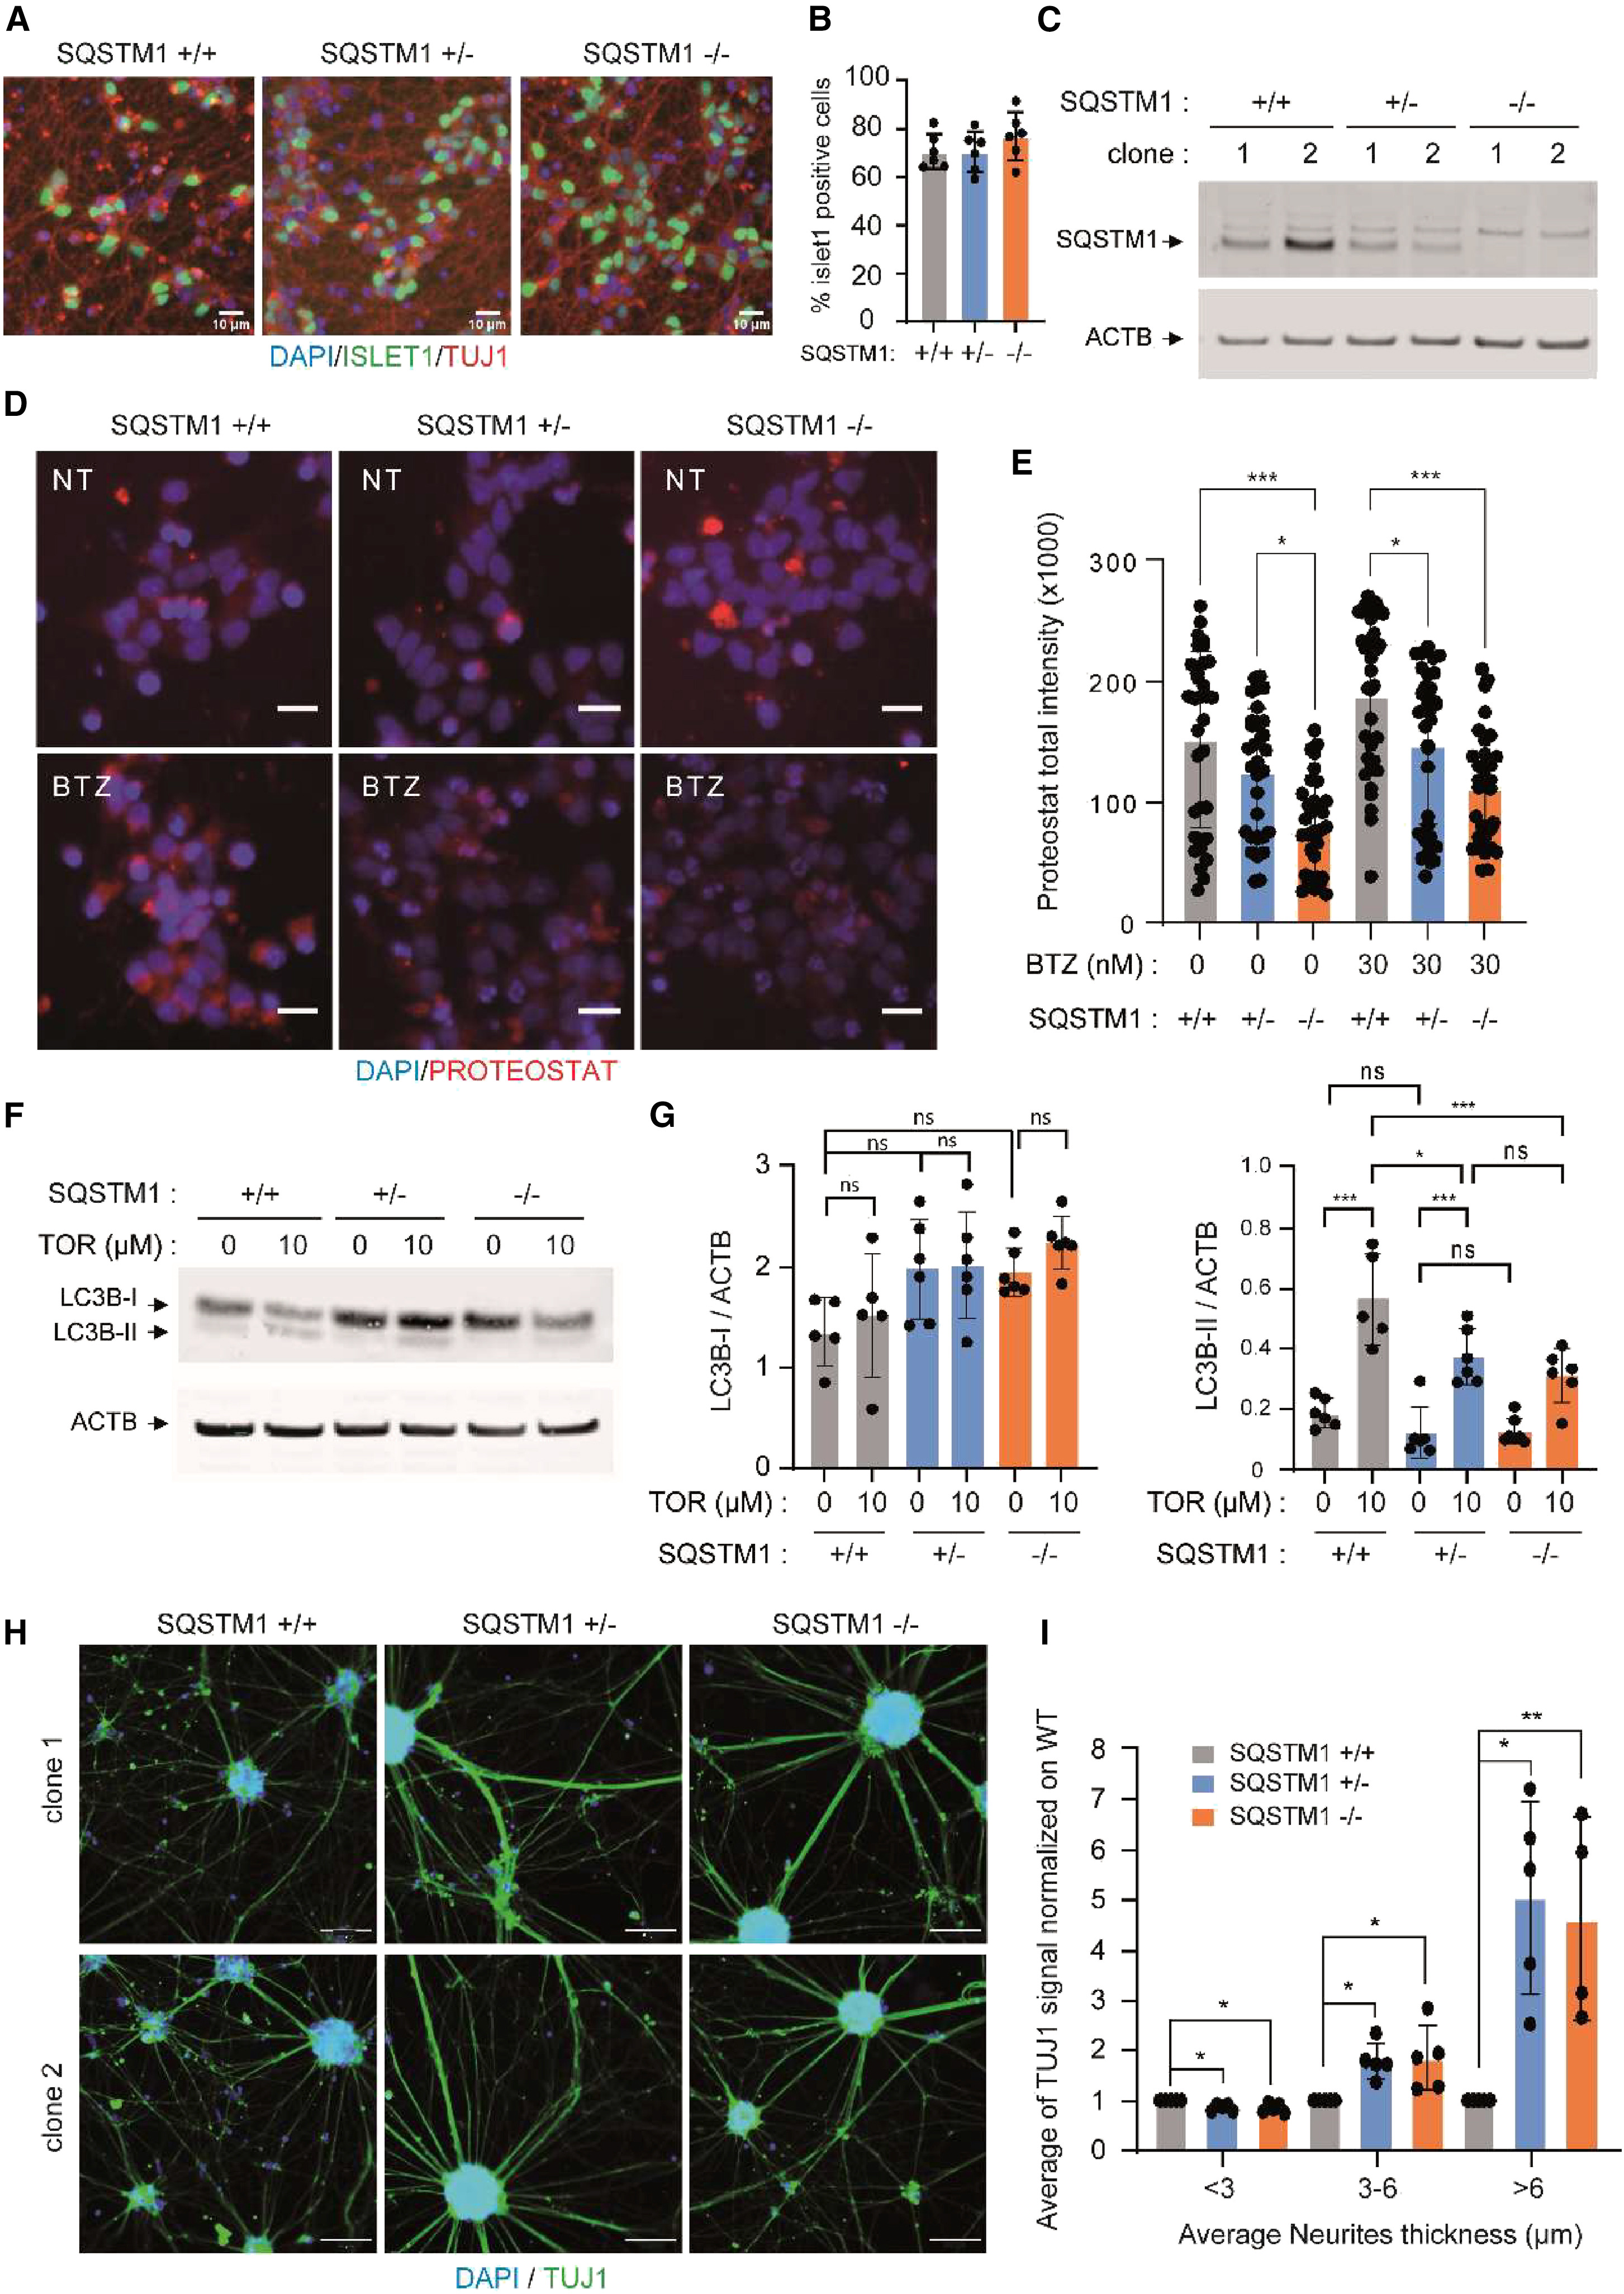
Motor neurons with heterozygous or homozygous SQSTM1 knockdown exhibit autophagy impairment and neuritic network perturbation
(A) Representative immunocytochemistry images show DAPI, ISLET1, and TUJ1 staining in hiPSC-derived MNs with SQSTM1 +/+, SQSTM1 +/−, and SQSTM1 −/− genotypes after 14 days of differentiation. Scale bars, 10 μm.
(B) Quantification of the percentage of ISLET1+ MNs derived from control and SQSTM1-edited hiPSCs (two clones per genotype) using automated microscopic acquisition and analysis. Data are presented as mean ± SD from three independent differentiations of MN progenitors.
(C) Western blot analysis of SQSTM1 and ACTB expression in SQSTM1 +/+, SQSTM1 +/−, and SQSTM1 −/− MNs derived from two edited hiPSC clones per genotype.
(D and E) Representative images and quantification of proteostat staining in SQSTM1 +/+, SQSTM1 +/−, and SQSTM1 −/− MNs not treated (NT) or treated for 24 h with 30 nM bortezomib (BTZ). Scale bars, 20 μm Data are presented as mean ± SD from three independent differentiations from MN progenitors. Statistical significance was determined using one-way ANOVA with Tukey’s multiple comparisons test. ∗p ≤ 0.05 and ∗∗∗p ≤ 0.001.
(F and G) Representative images and quantification of LC3B-II protein analyzed by Western blot after 24-h treatment with 10 μM Torin-1 in SQSTM1 +/+, SQSTM1 +/−, and SQSTM1 −/− MNs derived from two individual edited hiPSC clones. Data are presented as mean ± SEM from more than three independent differentiations from MN progenitors. Statistical significance was determined using one-way ANOVA with Tukey’s multiple comparisons test.
(H and I) Representative immunocytochemistry images of DAPI and TUJ1 staining in hiPSC-derived MNs with SQSTM1 +/+, SQSTM1 +/−, and SQSTM1 −/− genotypes after 24 days of differentiation. Scale bars, 50 μm. TUJ1 staining in MNs with different SQSTM1 genotypes was quantified and normalized to SQSTM1 +/+ MNs across three neurite thickness intervals. Data are presented as mean ± SD from more than three independent differentiations from MN progenitors. Statistical significance was determined using the Kruskal-Wallis test with Dunnett’s post hoc multiple comparisons test. ns: not significative, ∗p ≤ 0.05 and ∗∗p ≤ 0.01.