
Figure 2
- ID
- ZDB-IMAGE-260722-3
- Publication
- Roussange et al., 2026 - Integrative analysis of drug-gene signatures in human pluripotent stem cells reveals prazosin as a novel SQSTM1 regulator for ALS therapeutics
- All Figures
- Figures for Roussange et al., 2026
|
Figure 2
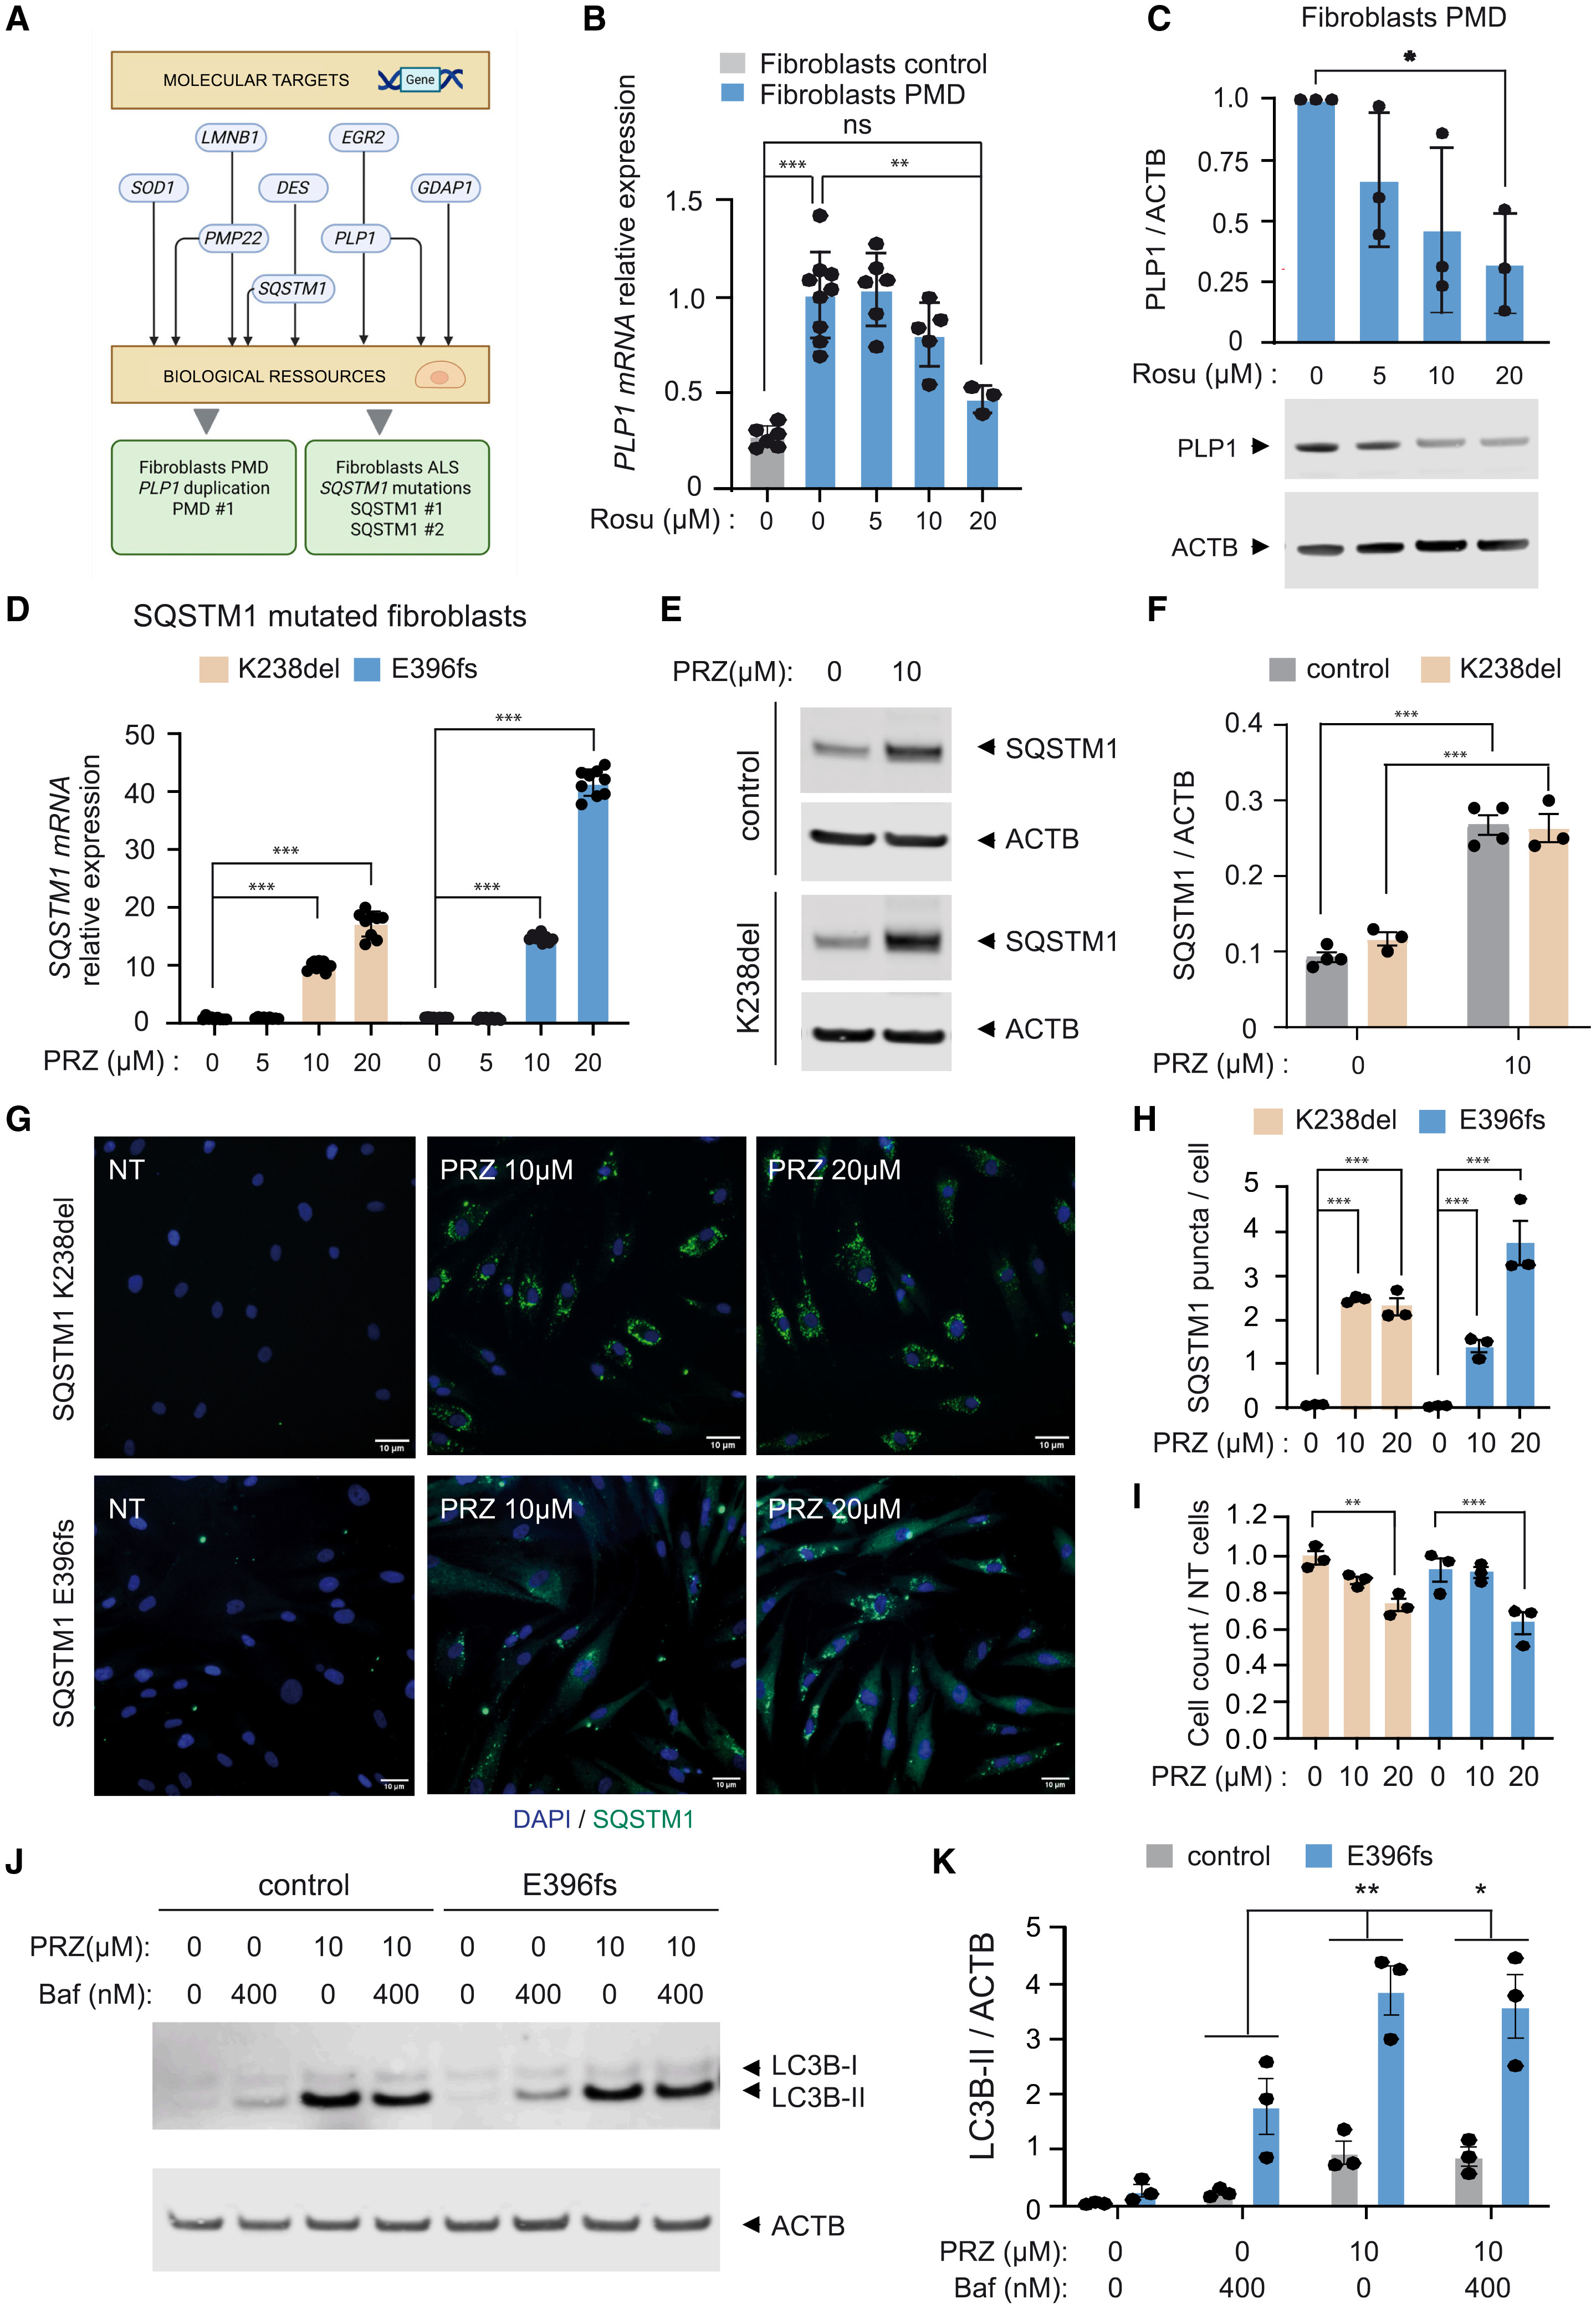
Rosuvastatin and prazosin regulate PLP1 and SQSTM1 transcripts in fibroblasts from PMD and FTD/ALS patients
(A) Schematic representation of the validation process for drug effects in fibroblasts derived from disease-affected patients.
(B) Graphs show PLP1 transcript expression levels in PMD-fibroblasts, analyzed by RT-qPCR following treatment with varying doses of rosuvastatin, compared to non-affected fibroblasts. Data are presented as mean ± SEM from three independent cultures and experiments (n = 3). Statistical significance was determined using one-way ANOVA with Tukey’s post hoc multiple comparisons test. ∗∗p ≤ 0.01 and ∗∗∗p ≤ 0.001.
(C) Western blotting analysis of PLP1 and ACTB proteins in PLP1 mutated fibroblasts treated with 5, 10, and 20μM of rosuvastatin. Data are shown as mean ± SEM of n = 3 independent cultures and experiments. Statistical significance was determined using one-way ANOVA with Dunnett’s post hoc multiple comparisons test. ∗p ≤ 0.05.
(D) Graphs of SQSTM1 transcript expression in FTD/ALS3 fibroblasts from two patients (SQSTM1 K238del and SQSTM1 E396fs), analyzed by RT-qPCR after 24 h treatment with various doses of prazosin. Data are represented as mean ± SEM from three independent cultures and experiments (n = 3). Statistical significance was determined using one-way ANOVA with Dunnett’s post hoc multiple comparisons test. ∗∗∗p ≤ 0.001.
(E and F) Representative images (E) and quantification (F) of SQSTM1 analyzed by Western blot in wild-type and SQSTM1 K238del mutated fibroblasts treated with 10 μM prazosin for 24 h. Data are presented as mean ± SEM from more than three independent experiments (n > 3). Statistical significance was determined using unpaired Student’s t test with Welch’s correction. ∗∗∗p ≤ 0.001.
(G) Representative immunocytochemistry images showing DAPI staining and SQSTM1 staining in SQSTM1-mutated FTD/ALS fibroblasts (K238del and E396fs). Scale bars, 20 μm.
(H and I) Quantifications of nuclei and SQSTM1 puncta per cell following 24 h treatment with 10 or 20 μM prazosin, determined through automated microscope acquisition and analysis. Data are expressed as mean ± SD from three independent cultures and experiments (n = 3). Statistical significance was determined using one-way ANOVA with Dunnett’s post hoc multiple comparisons test. ∗∗p ≤ 0.01 and ∗∗∗p ≤ 0.001.
(J and K) Representative images (J) and quantification (K) of LC3B analyzed by Western blot in non-mutated and SQSTM1 E396fs mutated fibroblasts treated with 10 μM prazosin for 24 h with and without 400 nM Bafilomycin A1 in the last 4 h. Data are presented as mean ± SEM from more than three independent experiments (n > 3). Statistical significance was determined using two-way ANOVA with Šídák’s post hoc test. ∗p ≤ 0.05 and ∗∗p ≤ 0.01.