IMAGE

Fig. 1

ID
ZDB-IMAGE-260716-53
Publication
Wang et al., 2026 - Checkpoint kinase 2 coordinates autophagy activation and Aurora kinase A degradation to regulate primary cilia for cell invasion
All Figures
Figures for Wang et al., 2026
Image
Figure Caption

Fig. 1

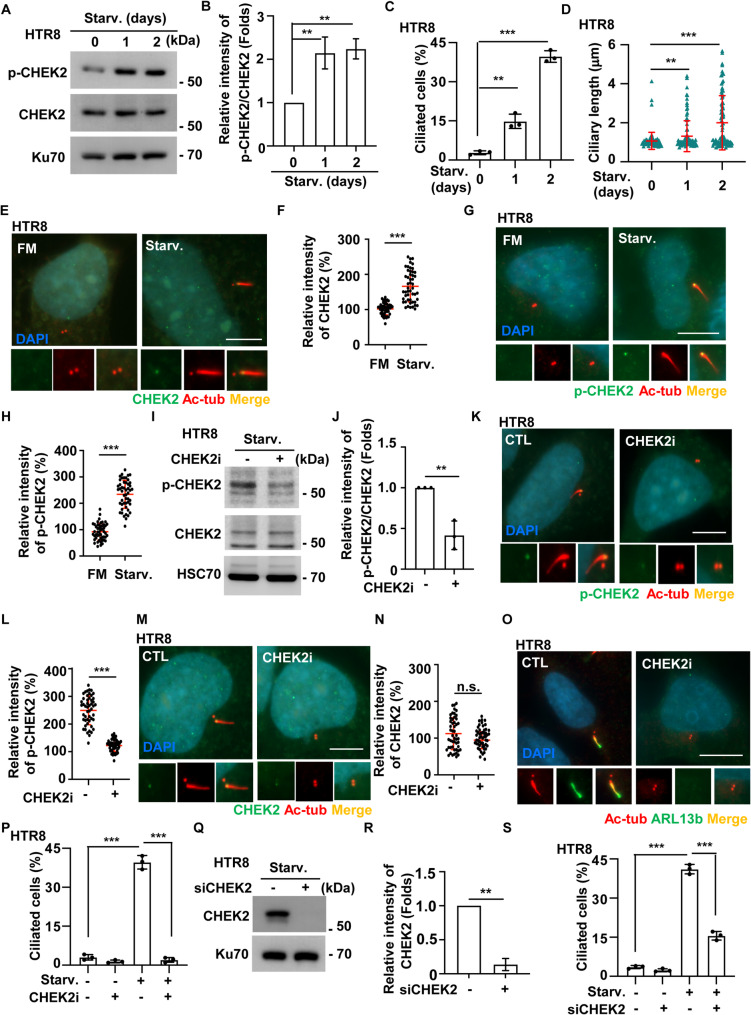
Serum starvation leads to CHEK2 phosphorylation that regulates primary cilia. A-B CHEK2 was phosphorylated in trophoblast HTR-8 cells upon serum starvation. (A) Extracts of HTR-8 cells under serum starvation (Starv.) for 0, 1, and 2 days were analyzed by Western blotting with antibodies against phosphorylated CHEK2 at Thr68 (p-CHEK2), CHEK2, and Ku70 (internal control). B Quantitative results for the relative intensity of p-CHEK2 to CHEK2 in (A). C-D Serum starvation induced primary ciliation. Quantitative results of (C) ciliated HTR-8 cells and (D) the length of primary cilia upon serum starvation for 0, 1, and 2 days. E-H (E-F) Total CHEK2 and (G-H) p-CHEK2 are localized to the base of primary cilia. CHEK2 of HTR-8 cells cultured in full-medium (FM) or serum-starved medium (Starv.) were observed by immunofluorescence staining with antibodies against CHEK2, p-CHEK2 and acetylated tubulin (Ac-tub). DNA were stained with DAPI. Scale bar: 10 μm. F and H Quantitative results for the relative intensity of CHEK2 and p-CHEK2 in (E) and (G), respectively. I-N CHEK2 inhibitor (CHEK2i) reduced CHEK2 activation upon serum starvation. I-J CHEK2i inhibited CHEK2 phosphorylation. I Extracts of HTR-8 cells in the presence or absence of CHEK2i under serum starvation were analyzed by Western blotting with antibodies against p-CHEK2, CHEK2, and HSC70. J Quantitative results for the relative intensity of p-CHEK2 to CHEK2 in I. K-N Reduction of phosphorylated CHEK2 at the ciliary base upon CHEK2i treatment. K-L Total CHEK2 and (M-N) phosphorylated p-CHEK2 of HTR-8 cells in the absence (CTL) or presence of CHEK2i under serum deprivation were observed by immunofluorescence staining with antibodies against CHEK2, p-CHEK2 and acetylated tubulin (Ac-tub). DNA were stained with DAPI. Scale bar: 10 μm. O-S Requirement of CHEK2 for primary ciliogenesis. O-P Inhibition of CHEK2 reduced primary cilia under serum starvation. O The primary cilia were reduced in CHEK2-inhibited HTR-8 cells under serum starvation. The axoneme (acetylated tubulin, Ac-tub) and ciliary membrane (ARL13b) were observed by immunofluorescence staining. DNA were stained with DAPI. Scale bars: 10 μm. P Quantitative results of ciliated HTR-8 cells. Q-S Depletion of CHEK2 reduced primary cilia under serum starvation. Q Western blot showing efficient depletion of CHEK2 by siCHEK2. R Quantitative results for the relative intensity of CHEK2 in Q. S Quantitative results of ciliated HTR-8 cells in the presence or absence of siCHEK2. **p < 0.01, ***p < 0.001, n.s.: no significance. These results are mean ± SD from three independent experiments. At least 300 cells were counted in each individual group

Acknowledgments
This image is the copyrighted work of the attributed author or publisher, and ZFIN has permission only to display this image to its users. Additional permissions should be obtained from the applicable author or publisher of the image. Full text @ Cell Commun. Signal.