
Fig. 7
- ID
- ZDB-IMAGE-260709-61
- Publication
- Valtorta et al., 2026 - Unprocessed U1 snRNAs as a biomarker of INTS11- and BRAT1-related neurodevelopmental disorders
- All Figures
- Figures for Valtorta et al., 2026
|
Fig. 7
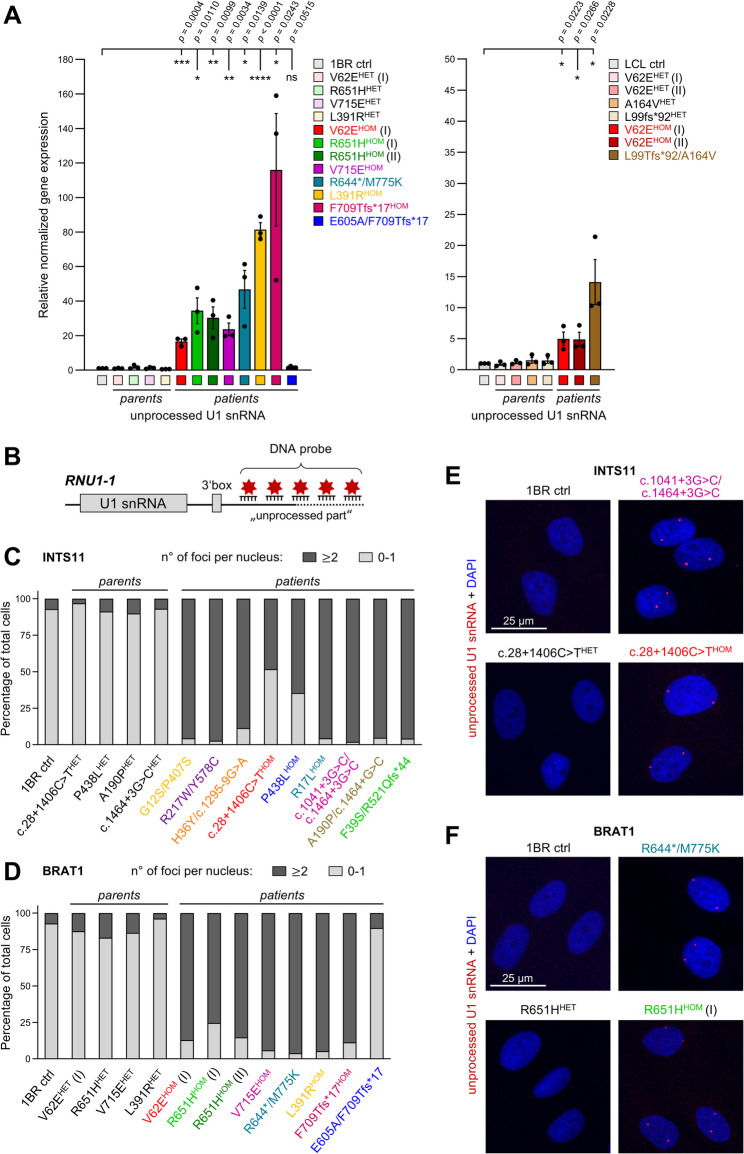
Nuclear accumulation of 3’-extended unprocessed U1 snRNAs in patient-derived cells with BRAT1 and INTS11 mutations. A RT-qPCR analysis of unprocessed RNU1-1 transcripts in control, parent and BRAT1-mutated patient-derived fibroblasts (left) and LCLs (right). Data are presented as the mean ± SEM (N = 3; N = 4 for E605A/F709Tfs*17 patient). Statistical significance was calculated using a two-tailed Student’s t-test (ns – not significant, *p < 0.05, **p < 0.01, ***p < 0.001, ****p < 0.0001). B Schematic representation of the FISH strategy used to detect 3’-extended unprocessed RNU1-1 transcripts. The DNA probe anneals to the unprocessed region of U1 snRNA approximately 1000 bp downstream of the canonical 3’ box. C-D Quantification of FISH-detected unprocessed U1 snRNA foci in INTS11-mutated (C) and BRAT1-mutated (D) fibroblasts. Results are expressed as the percentage of nuclei containing U1 foci. For each genotype, at least 121 cells were quantified (n ≥ 121) across two independent biological replicates. E-F Representative FISH images of INTS11-mutated (E) or BRAT1-mutated (F) fibroblasts, along with the 1BR control and unaffected parents. Unprocessed U1 snRNAs are visualized using specific fluorescent probes (red), while nuclei are stained with DAPI (blue). Scale bar: 25 μm